

Specific Climate Impact of Freight transport modes over various time horizons
Specific Climate Impact of Passenger transport modes over various time horizons
7.00
GTP5
GTP5
GTP20
GTP50
8.00
10
–15
K
per tkm
10
–15
K
per Pkm
10
–15
K
per Pkm
10
–15
K
per Pkm
10
–15
K
per tkm
6.00
5.00
4.00
3.00
2.00
1.00
0.00
0.00
−0.20
0.20
0.40
0.60
0.80
0.00
−0.20
0.20
0.40
0.60
0.80
1.00
1.00
Aircraft LDT
HDT
Rail
Ship
Car Aircraft 2Wheel Bus
Rail
Aircraft LDT
HDT
Rail
Ship
Aircraft LDT
HDT
Rail
Ship
GTP20
0.00
−0.05
0.05
0.10
0.15
0.20
0.25
0.00
−0.05
0.05
0.10
0.15
0.20
0.25
Car Aircraft 2Wheel Bus
Rail
GTP50
0.00
−0.02
0.02
0.04
0.06
0.08
0.10
0.00
−0.02
0.02
0.04
0.06
0.08
0.10
Car Aircraft 2Wheel Bus
Rail
−1.00
7.00
8.00
6.00
5.00
4.00
3.00
2.00
1.00
0.00
−1.00
1.40
1.60
1.20
1.00
0.80
0.60
0.40
0.20
0.00
−0.20
1.40
1.60
1.20
1.00
0.80
0.60
0.40
0.20
0.00
−0.20
0.70
0.80
0.60
0.50
0.40
0.30
0.20
0.10
0.00
−0.10
0.70
0.80
0.60
0.50
0.40
0.30
0.20
0.10
0.00
−0.10
4.50
0.61
0.47
0.40
0.49
0.31
0.07
−0.03
0.06
0.10
0.45
0.11
0.05
0.08
0.07
0.02
0.02
0.07
0.05
0.03
0.02
0.02
CO
2 + SLCF
CO
2
CO
2 + SLCF
CO
2
CO
2 + SLCF
CO
2
CO
2 + SLCF
CO
2
CO
2 + SLCF
CO
2
CO
2 + SLCF
CO
2
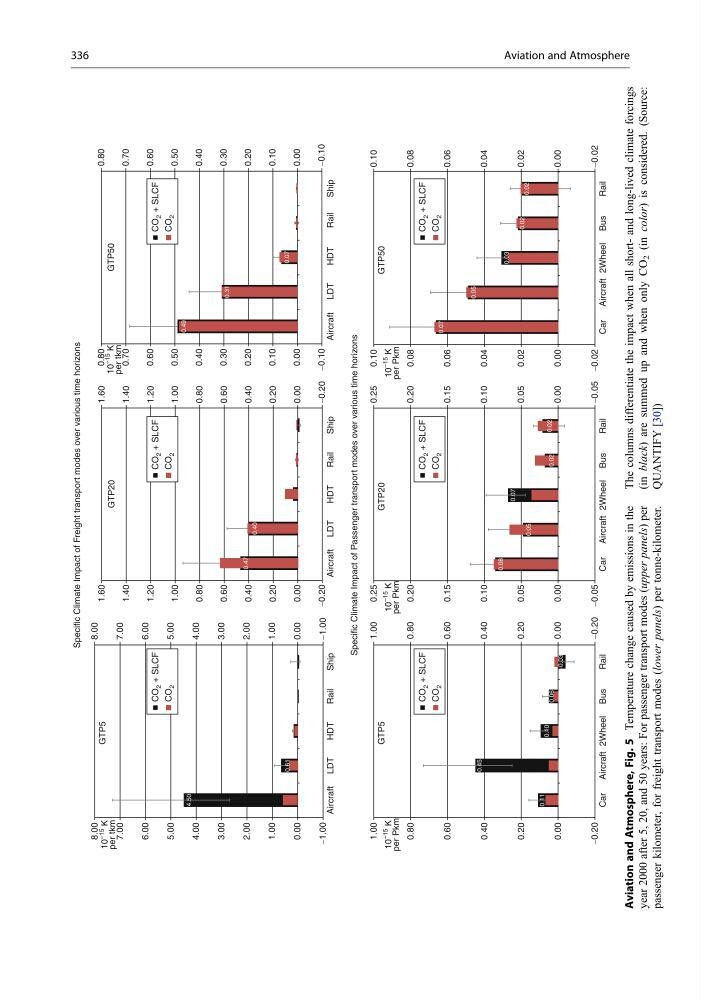
Aviation and Atmosphere, Fig. 5
Temperature change caused by emissions in the
year 2000 after 5, 20, and 50 years: For passenger transport modes (upper panels) per
passenger kilometer, for freight transport modes (lower panels) per tonne-kilometer.
The columns differentiate the impact when all short- and long-lived climate forcings
(in black) are summed up and when only CO
2 (in color) is considered. (Source:
QUANTIFY [30])
336
Aviation and Atmosphere
Specific Climate Impact of Passenger transport modes over various time horizons
7.00
GTP5
GTP5
GTP20
GTP50
8.00
10
–15
K
per tkm
10
–15
K
per Pkm
10
–15
K
per Pkm
10
–15
K
per Pkm
10
–15
K
per tkm
6.00
5.00
4.00
3.00
2.00
1.00
0.00
0.00
−0.20
0.20
0.40
0.60
0.80
0.00
−0.20
0.20
0.40
0.60
0.80
1.00
1.00
Aircraft LDT
HDT
Rail
Ship
Car Aircraft 2Wheel Bus
Rail
Aircraft LDT
HDT
Rail
Ship
Aircraft LDT
HDT
Rail
Ship
GTP20
0.00
−0.05
0.05
0.10
0.15
0.20
0.25
0.00
−0.05
0.05
0.10
0.15
0.20
0.25
Car Aircraft 2Wheel Bus
Rail
GTP50
0.00
−0.02
0.02
0.04
0.06
0.08
0.10
0.00
−0.02
0.02
0.04
0.06
0.08
0.10
Car Aircraft 2Wheel Bus
Rail
−1.00
7.00
8.00
6.00
5.00
4.00
3.00
2.00
1.00
0.00
−1.00
1.40
1.60
1.20
1.00
0.80
0.60
0.40
0.20
0.00
−0.20
1.40
1.60
1.20
1.00
0.80
0.60
0.40
0.20
0.00
−0.20
0.70
0.80
0.60
0.50
0.40
0.30
0.20
0.10
0.00
−0.10
0.70
0.80
0.60
0.50
0.40
0.30
0.20
0.10
0.00
−0.10
4.50
0.61
0.47
0.40
0.49
0.31
0.07
−0.03
0.06
0.10
0.45
0.11
0.05
0.08
0.07
0.02
0.02
0.07
0.05
0.03
0.02
0.02
CO
2 + SLCF
CO
2
CO
2 + SLCF
CO
2
CO
2 + SLCF
CO
2
CO
2 + SLCF
CO
2
CO
2 + SLCF
CO
2
CO
2 + SLCF
CO
2
Aviation and Atmosphere, Fig. 5
Temperature change caused by emissions in the
year 2000 after 5, 20, and 50 years: For passenger transport modes (upper panels) per
passenger kilometer, for freight transport modes (lower panels) per tonne-kilometer.
The columns differentiate the impact when all short- and long-lived climate forcings
(in black) are summed up and when only CO
2 (in color) is considered. (Source:
QUANTIFY [30])
336
Aviation and Atmosphere