

– By directly triggering additional clouds (e.g.,
contrails and contrail cirrus)
On the other hand, the global and economic
system is largely dependent on an efficient transport system. This dependency has grown during
recent decades not only because of an increasing
world population but mainly because of globalization. Life style and the availability of cheaper
transport (mainly because of lack of internalization of external costs) in developed and developing countries are also enhancing demand. Further
very strong growth of the transport sector is
expected in developing countries. In the long
term, a sustainable transport system is needed
that satisfies the demands of economy and population while following the constraints of climate
change policy measures. In order to meet these
constraints clear information on the climatic
impact of different transport emissions is needed.
Here we concentrate on aviation, a smaller part
with respect to goods and passengers transported,
but with many climatically relevant facets because
of its already mentioned main emission height of
about 10 km.
Each kilogram of aviation fuel, overwhelmingly kerosene, when burned in an engine, must
lead to 3.16 kg carbon dioxide (CO 2 ) and 1.0 kg
of water vapor (H 2 O). These unavoidable emissions are two major reasons of an air traffic influence on the radiative transfer in the atmosphere,
but not the only ones. The first one is nearly
completely independent of the place where the
emission occurs, because of the long lifetime
of anthropogenic carbon dioxide being well
above 100 years and thus resulting in a globally
FAST (B2, A1, A1)
CONSAVE (ULS, RPP, FW, DtE)
IPCC (Fe1, Fa1, Fc1)
ANCAT/EC2 (1992, 2015)
NASA (1992, 1999, 2015)
AERO-2K
SAGE
Aviation Fuel Emissions
2500
2000
1500
1000
Fuel Emissions (Mt CO
2 yr −1
)
500
0
Sausen and Schumann (2000)
IPCC Scenario Fa1
International Energy Agency (IEA)
FAST-A1(1)
FAST-B2(t1)
Year
1990
2000
2010
2020
2030
2040
2050
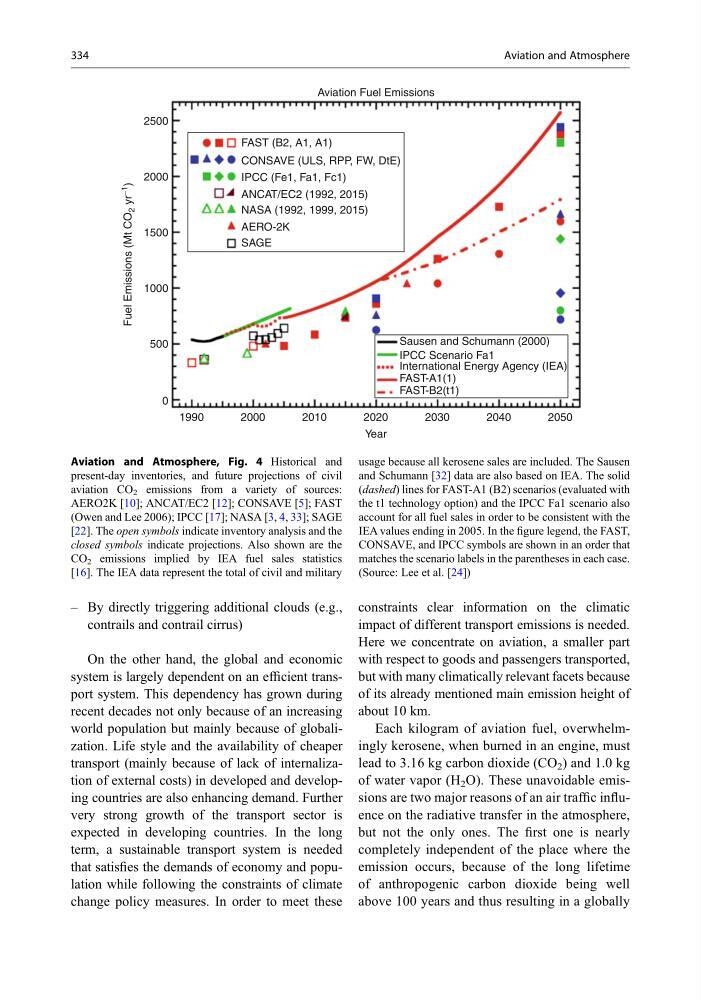
Aviation and Atmosphere, Fig. 4 Historical and
present-day inventories, and future projections of civil
aviation CO 2 emissions from a variety of sources:
AERO2K [10]; ANCAT/EC2 [12]; CONSAVE [5]; FAST
(Owen and Lee 2006); IPCC [17]; NASA [3, 4, 33]; SAGE
[22]. The open symbols indicate inventory analysis and the
closed symbols indicate projections. Also shown are the
CO 2 emissions implied by IEA fuel sales statistics
[16]. The IEA data represent the total of civil and military
usage because all kerosene sales are included. The Sausen
and Schumann [32] data are also based on IEA. The solid
(dashed) lines for FAST-A1 (B2) scenarios (evaluated with
the t1 technology option) and the IPCC Fa1 scenario also
account for all fuel sales in order to be consistent with the
IEA values ending in 2005. In the figure legend, the FAST,
CONSAVE, and IPCC symbols are shown in an order that
matches the scenario labels in the parentheses in each case.
(Source: Lee et al. [24])
334
Aviation and Atmosphere
contrails and contrail cirrus)
On the other hand, the global and economic
system is largely dependent on an efficient transport system. This dependency has grown during
recent decades not only because of an increasing
world population but mainly because of globalization. Life style and the availability of cheaper
transport (mainly because of lack of internalization of external costs) in developed and developing countries are also enhancing demand. Further
very strong growth of the transport sector is
expected in developing countries. In the long
term, a sustainable transport system is needed
that satisfies the demands of economy and population while following the constraints of climate
change policy measures. In order to meet these
constraints clear information on the climatic
impact of different transport emissions is needed.
Here we concentrate on aviation, a smaller part
with respect to goods and passengers transported,
but with many climatically relevant facets because
of its already mentioned main emission height of
about 10 km.
Each kilogram of aviation fuel, overwhelmingly kerosene, when burned in an engine, must
lead to 3.16 kg carbon dioxide (CO 2 ) and 1.0 kg
of water vapor (H 2 O). These unavoidable emissions are two major reasons of an air traffic influence on the radiative transfer in the atmosphere,
but not the only ones. The first one is nearly
completely independent of the place where the
emission occurs, because of the long lifetime
of anthropogenic carbon dioxide being well
above 100 years and thus resulting in a globally
FAST (B2, A1, A1)
CONSAVE (ULS, RPP, FW, DtE)
IPCC (Fe1, Fa1, Fc1)
ANCAT/EC2 (1992, 2015)
NASA (1992, 1999, 2015)
AERO-2K
SAGE
Aviation Fuel Emissions
2500
2000
1500
1000
Fuel Emissions (Mt CO
2 yr −1
)
500
0
Sausen and Schumann (2000)
IPCC Scenario Fa1
International Energy Agency (IEA)
FAST-A1(1)
FAST-B2(t1)
Year
1990
2000
2010
2020
2030
2040
2050
Aviation and Atmosphere, Fig. 4 Historical and
present-day inventories, and future projections of civil
aviation CO 2 emissions from a variety of sources:
AERO2K [10]; ANCAT/EC2 [12]; CONSAVE [5]; FAST
(Owen and Lee 2006); IPCC [17]; NASA [3, 4, 33]; SAGE
[22]. The open symbols indicate inventory analysis and the
closed symbols indicate projections. Also shown are the
CO 2 emissions implied by IEA fuel sales statistics
[16]. The IEA data represent the total of civil and military
usage because all kerosene sales are included. The Sausen
and Schumann [32] data are also based on IEA. The solid
(dashed) lines for FAST-A1 (B2) scenarios (evaluated with
the t1 technology option) and the IPCC Fa1 scenario also
account for all fuel sales in order to be consistent with the
IEA values ending in 2005. In the figure legend, the FAST,
CONSAVE, and IPCC symbols are shown in an order that
matches the scenario labels in the parentheses in each case.
(Source: Lee et al. [24])
334
Aviation and Atmosphere