

example: How much of the nitrogen oxide emission remains available for the formation of ozone
in the troposphere, a potent but short-lived greenhouse gas of the atmosphere? On top of these
challenges we have to face the dependence of
the effects on the location of the emissions for
all short-lived substances, severest for air traffic,
where for example the emission height is decisive
for the formation of a long-lasting contrail. The
QUANTIFY project has evaluated existing metrics and has introduced new concepts (for details
see Fuglestvedt et al. 2009). All these metrics
have been evaluated for emissions from the transport sector both in terms of integrated radiative
Fuel Use
Sausen and Schumann (2000)
IPCC Scenario Fa1
International Energy Agency (IEA)
RPK
RPK annual change
Fuel Use (Tg yr −1
)
CO
2 emission (10
3
Tg yr −1
)
300
250
200
150
100
50
0
0
5
10
15
20
25
30
1940
1950
1960
1970
1980
1990
2000
2010
7.0
6.0
5.0
4.0
3.0
Aviation CO 2 fraction (%)
2.0
1.0
0.0
1940
1950
1960
1970
1980
1990
2000
2010
RPK (10 12 )
0
1
2
3
4
5
0.8
RPK annual change (10 12 RPK yr −1 )
0.6
0.4
0.2
0.0
Year
Year
Oil crisis
Oil crisis
Gulf crisis
Asian crisis
WTC attack
SARS
Aviation Fuel Use and RPK
Aviation CO 2 Emissions
Anthropogenic CO 2
Aviation CO 2 (x10)
Aviation CO 2 fraction
(x10)
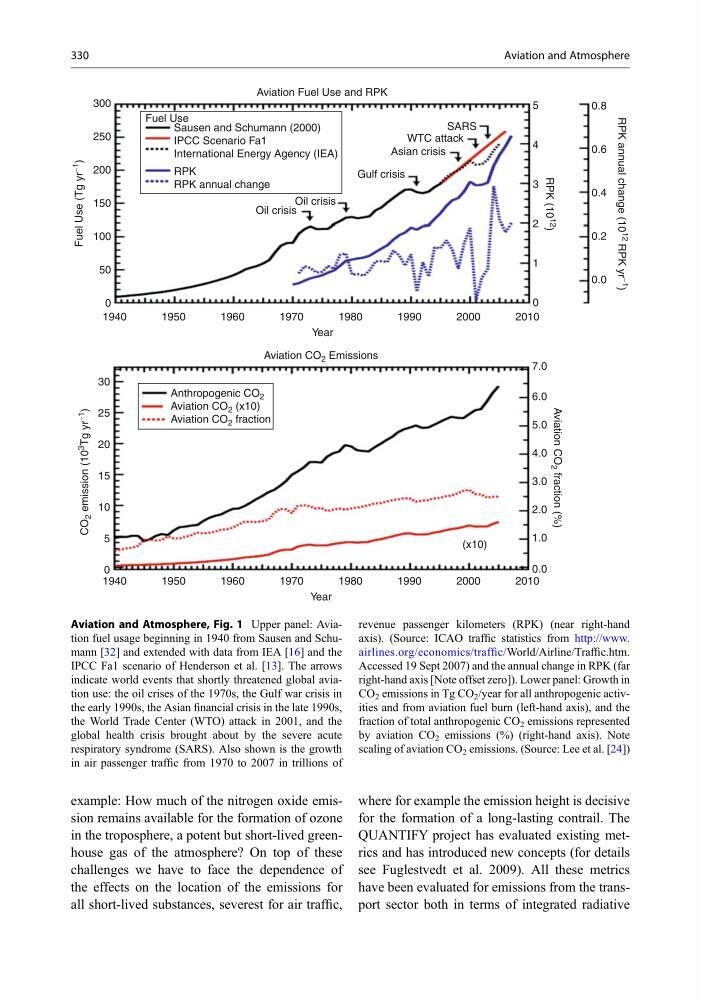
Aviation and Atmosphere, Fig. 1 Upper panel: Aviation fuel usage beginning in 1940 from Sausen and Schumann [32] and extended with data from IEA [16] and the
IPCC Fa1 scenario of Henderson et al. [13]. The arrows
indicate world events that shortly threatened global aviation use: the oil crises of the 1970s, the Gulf war crisis in
the early 1990s, the Asian financial crisis in the late 1990s,
the World Trade Center (WTO) attack in 2001, and the
global health crisis brought about by the severe acute
respiratory syndrome (SARS). Also shown is the growth
in air passenger traffic from 1970 to 2007 in trillions of
revenue passenger kilometers (RPK) (near right-hand
axis). (Source: ICAO traffic statistics from http://www.
airlines.org/economics/traffic/World/Airline/Traffic.htm.
Accessed 19 Sept 2007) and the annual change in RPK (far
right-hand axis [Note offset zero]). Lower panel: Growth in
CO 2 emissions in Tg CO 2 /year for all anthropogenic activities and from aviation fuel burn (left-hand axis), and the
fraction of total anthropogenic CO 2 emissions represented
by aviation CO 2 emissions (%) (right-hand axis). Note
scaling of aviation CO 2 emissions. (Source: Lee et al. [24])
330
Aviation and Atmosphere
in the troposphere, a potent but short-lived greenhouse gas of the atmosphere? On top of these
challenges we have to face the dependence of
the effects on the location of the emissions for
all short-lived substances, severest for air traffic,
where for example the emission height is decisive
for the formation of a long-lasting contrail. The
QUANTIFY project has evaluated existing metrics and has introduced new concepts (for details
see Fuglestvedt et al. 2009). All these metrics
have been evaluated for emissions from the transport sector both in terms of integrated radiative
Fuel Use
Sausen and Schumann (2000)
IPCC Scenario Fa1
International Energy Agency (IEA)
RPK
RPK annual change
Fuel Use (Tg yr −1
)
CO
2 emission (10
3
Tg yr −1
)
300
250
200
150
100
50
0
0
5
10
15
20
25
30
1940
1950
1960
1970
1980
1990
2000
2010
7.0
6.0
5.0
4.0
3.0
Aviation CO 2 fraction (%)
2.0
1.0
0.0
1940
1950
1960
1970
1980
1990
2000
2010
RPK (10 12 )
0
1
2
3
4
5
0.8
RPK annual change (10 12 RPK yr −1 )
0.6
0.4
0.2
0.0
Year
Year
Oil crisis
Oil crisis
Gulf crisis
Asian crisis
WTC attack
SARS
Aviation Fuel Use and RPK
Aviation CO 2 Emissions
Anthropogenic CO 2
Aviation CO 2 (x10)
Aviation CO 2 fraction
(x10)
Aviation and Atmosphere, Fig. 1 Upper panel: Aviation fuel usage beginning in 1940 from Sausen and Schumann [32] and extended with data from IEA [16] and the
IPCC Fa1 scenario of Henderson et al. [13]. The arrows
indicate world events that shortly threatened global aviation use: the oil crises of the 1970s, the Gulf war crisis in
the early 1990s, the Asian financial crisis in the late 1990s,
the World Trade Center (WTO) attack in 2001, and the
global health crisis brought about by the severe acute
respiratory syndrome (SARS). Also shown is the growth
in air passenger traffic from 1970 to 2007 in trillions of
revenue passenger kilometers (RPK) (near right-hand
axis). (Source: ICAO traffic statistics from http://www.
airlines.org/economics/traffic/World/Airline/Traffic.htm.
Accessed 19 Sept 2007) and the annual change in RPK (far
right-hand axis [Note offset zero]). Lower panel: Growth in
CO 2 emissions in Tg CO 2 /year for all anthropogenic activities and from aviation fuel burn (left-hand axis), and the
fraction of total anthropogenic CO 2 emissions represented
by aviation CO 2 emissions (%) (right-hand axis). Note
scaling of aviation CO 2 emissions. (Source: Lee et al. [24])
330
Aviation and Atmosphere