

Air Quality Guidelines
and Standards,
Table 2 The impact of
socioeconomic status on
mortality
Mortality rate ratio ¼
lowest quartile
highest quartile of socioeconomical status
Mortality
Men
Women
All cause
2.02 (1.95–2.09)
a
1.29 (1.25–1.32)
Heart disease
1.88 (1.83–1.93)
1.84 (1.76–1.93)
Stroke
2.25 (2.14–2.37)
1.53 (1.44–1.62)
Diabetes
2.19 (2.07–2.32)
1.85 (1.72–2.00)
COPD
3.59 (3.35–3.83)
2.09 (1.91–2.30)
Lung cancer
2.15 (2.07–2.23)
1.31 (1.25–1.39)
Breast cancer
–
0.76 (0.73–0.79)
Colorectal cancer
1.21 (1.16–1.27)
0.91 (0.86–0.96)
External causes
2.67 (2.58–2.78)
1.41 (1.35–1.48)
Source: Steenland et al. [59]
a 95% confidence interval
Lung cancer
0%
1%
2%
3%
4%
5%
6%
7%
Diarrhoea
Lower respiratory infections
Other unintentional injuries
Malaria
Road traffic injuries
COPD
Perinatal conditions
Ischaemic heart disease
Childhood cluster disease
Lead-caused mental retardation*
Drownings
HIV/AIDS
Malnutrition
Cerebrovascular disease
Asthma
Tuberculosis
Suicide
Depression
Poisonings
Falls
Hearing loss
Violence
Lymphatic filariasis
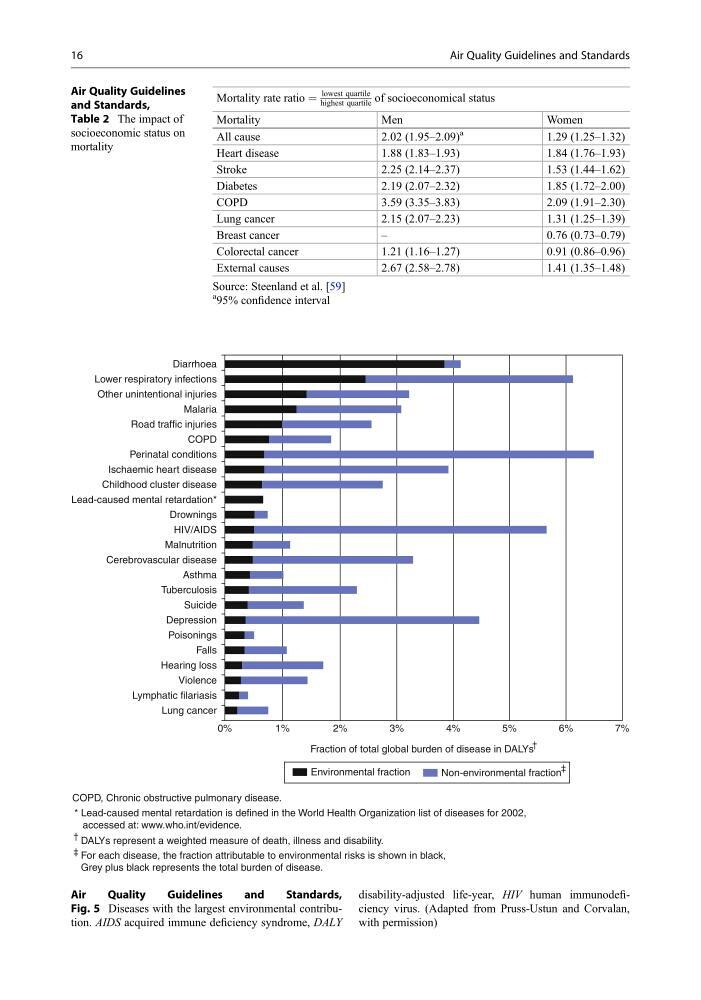
Fraction of total global burden of disease in DALYs
COPD, Chronic obstructive pulmonary disease.
* Lead-caused mental retardation is defined in the World Health Organization list of diseases for 2002,
accessed at: www.who.int/evidence.
DALYs represent a weighted measure of death, illness and disability.
For each disease, the fraction attributable to environmental risks is shown in black,
Grey plus black represents the total burden of disease.
Environmental fraction
Non-environmental fraction
Air
Quality
Guidelines
and
Standards,
Fig. 5 Diseases with the largest environmental contribution. AIDS acquired immune deficiency syndrome, DALY
disability-adjusted life-year, HIV human immunodeficiency virus. (Adapted from Pruss-Ustun and Corvalan,
with permission)
16
Air Quality Guidelines and Standards
and Standards,
Table 2 The impact of
socioeconomic status on
mortality
Mortality rate ratio ¼
lowest quartile
highest quartile of socioeconomical status
Mortality
Men
Women
All cause
2.02 (1.95–2.09)
a
1.29 (1.25–1.32)
Heart disease
1.88 (1.83–1.93)
1.84 (1.76–1.93)
Stroke
2.25 (2.14–2.37)
1.53 (1.44–1.62)
Diabetes
2.19 (2.07–2.32)
1.85 (1.72–2.00)
COPD
3.59 (3.35–3.83)
2.09 (1.91–2.30)
Lung cancer
2.15 (2.07–2.23)
1.31 (1.25–1.39)
Breast cancer
–
0.76 (0.73–0.79)
Colorectal cancer
1.21 (1.16–1.27)
0.91 (0.86–0.96)
External causes
2.67 (2.58–2.78)
1.41 (1.35–1.48)
Source: Steenland et al. [59]
a 95% confidence interval
Lung cancer
0%
1%
2%
3%
4%
5%
6%
7%
Diarrhoea
Lower respiratory infections
Other unintentional injuries
Malaria
Road traffic injuries
COPD
Perinatal conditions
Ischaemic heart disease
Childhood cluster disease
Lead-caused mental retardation*
Drownings
HIV/AIDS
Malnutrition
Cerebrovascular disease
Asthma
Tuberculosis
Suicide
Depression
Poisonings
Falls
Hearing loss
Violence
Lymphatic filariasis
Fraction of total global burden of disease in DALYs
COPD, Chronic obstructive pulmonary disease.
* Lead-caused mental retardation is defined in the World Health Organization list of diseases for 2002,
accessed at: www.who.int/evidence.
DALYs represent a weighted measure of death, illness and disability.
For each disease, the fraction attributable to environmental risks is shown in black,
Grey plus black represents the total burden of disease.
Environmental fraction
Non-environmental fraction
Air
Quality
Guidelines
and
Standards,
Fig. 5 Diseases with the largest environmental contribution. AIDS acquired immune deficiency syndrome, DALY
disability-adjusted life-year, HIV human immunodeficiency virus. (Adapted from Pruss-Ustun and Corvalan,
with permission)
16
Air Quality Guidelines and Standards