

Figure 5 provides a related perspective by
contrasting environmental with non-environmental contributions to specific categories of
disease using disability-adjusted life years as an
endpoint [55]. The merits of monetizing risks and
benefits as statistical life-years versus lives have
been reviewed by Sunstein [61]. Of special note
are four diseases: lower respiratory infections,
chronic obstructive pulmonary disease (COPD),
ischemic heart disease, and lung cancer. The first
three of these conditions account for about 4% of
the total global burden disease in disabilityadjusted life years while lung cancer accounts
for about 1%. Air pollution is generally viewed
as a contributor to global disease burden. However, its contribution needs to be placed in
perspective relative to other major contributors
to ill health.
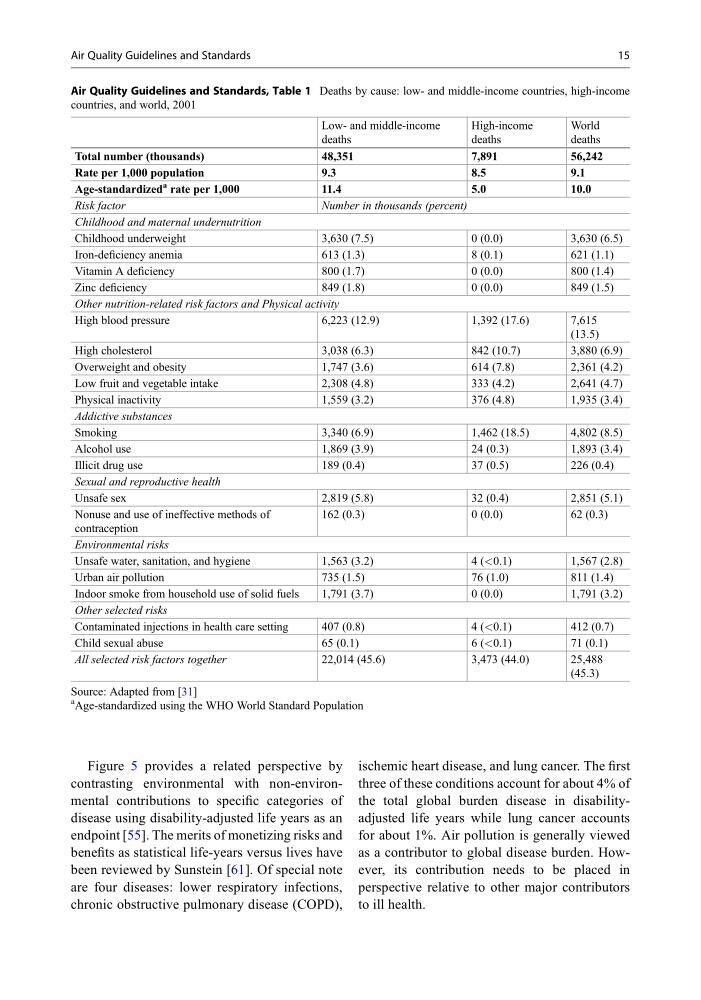
Air Quality Guidelines and Standards, Table 1 Deaths by cause: low- and middle-income countries, high-income
countries, and world, 2001
Low- and middle-income
deaths
High-income
deaths
World
deaths
Total number (thousands)
48,351
7,891
56,242
Rate per 1,000 population
9.3
8.5
9.1
Age-standardized
a rate per 1,000
11.4
5.0
10.0
Risk factor
Number in thousands (percent)
Childhood and maternal undernutrition
Childhood underweight
3,630 (7.5)
0 (0.0)
3,630 (6.5)
Iron-deficiency anemia
613 (1.3)
8 (0.1)
621 (1.1)
Vitamin A deficiency
800 (1.7)
0 (0.0)
800 (1.4)
Zinc deficiency
849 (1.8)
0 (0.0)
849 (1.5)
Other nutrition-related risk factors and Physical activity
High blood pressure
6,223 (12.9)
1,392 (17.6)
7,615
(13.5)
High cholesterol
3,038 (6.3)
842 (10.7)
3,880 (6.9)
Overweight and obesity
1,747 (3.6)
614 (7.8)
2,361 (4.2)
Low fruit and vegetable intake
2,308 (4.8)
333 (4.2)
2,641 (4.7)
Physical inactivity
1,559 (3.2)
376 (4.8)
1,935 (3.4)
Addictive substances
Smoking
3,340 (6.9)
1,462 (18.5)
4,802 (8.5)
Alcohol use
1,869 (3.9)
24 (0.3)
1,893 (3.4)
Illicit drug use
189 (0.4)
37 (0.5)
226 (0.4)
Sexual and reproductive health
Unsafe sex
2,819 (5.8)
32 (0.4)
2,851 (5.1)
Nonuse and use of ineffective methods of
contraception
162 (0.3)
0 (0.0)
62 (0.3)
Environmental risks
Unsafe water, sanitation, and hygiene
1,563 (3.2)
4 (<0.1)
1,567 (2.8)
Urban air pollution
735 (1.5)
76 (1.0)
811 (1.4)
Indoor smoke from household use of solid fuels
1,791 (3.7)
0 (0.0)
1,791 (3.2)
Other selected risks
Contaminated injections in health care setting
407 (0.8)
4 (<0.1)
412 (0.7)
Child sexual abuse
65 (0.1)
6 (<0.1)
71 (0.1)
All selected risk factors together
22,014 (45.6)
3,473 (44.0)
25,488
(45.3)
Source: Adapted from [31]
a Age-standardized using the WHO World Standard Population
Air Quality Guidelines and Standards
15
contrasting environmental with non-environmental contributions to specific categories of
disease using disability-adjusted life years as an
endpoint [55]. The merits of monetizing risks and
benefits as statistical life-years versus lives have
been reviewed by Sunstein [61]. Of special note
are four diseases: lower respiratory infections,
chronic obstructive pulmonary disease (COPD),
ischemic heart disease, and lung cancer. The first
three of these conditions account for about 4% of
the total global burden disease in disabilityadjusted life years while lung cancer accounts
for about 1%. Air pollution is generally viewed
as a contributor to global disease burden. However, its contribution needs to be placed in
perspective relative to other major contributors
to ill health.
Air Quality Guidelines and Standards, Table 1 Deaths by cause: low- and middle-income countries, high-income
countries, and world, 2001
Low- and middle-income
deaths
High-income
deaths
World
deaths
Total number (thousands)
48,351
7,891
56,242
Rate per 1,000 population
9.3
8.5
9.1
Age-standardized
a rate per 1,000
11.4
5.0
10.0
Risk factor
Number in thousands (percent)
Childhood and maternal undernutrition
Childhood underweight
3,630 (7.5)
0 (0.0)
3,630 (6.5)
Iron-deficiency anemia
613 (1.3)
8 (0.1)
621 (1.1)
Vitamin A deficiency
800 (1.7)
0 (0.0)
800 (1.4)
Zinc deficiency
849 (1.8)
0 (0.0)
849 (1.5)
Other nutrition-related risk factors and Physical activity
High blood pressure
6,223 (12.9)
1,392 (17.6)
7,615
(13.5)
High cholesterol
3,038 (6.3)
842 (10.7)
3,880 (6.9)
Overweight and obesity
1,747 (3.6)
614 (7.8)
2,361 (4.2)
Low fruit and vegetable intake
2,308 (4.8)
333 (4.2)
2,641 (4.7)
Physical inactivity
1,559 (3.2)
376 (4.8)
1,935 (3.4)
Addictive substances
Smoking
3,340 (6.9)
1,462 (18.5)
4,802 (8.5)
Alcohol use
1,869 (3.9)
24 (0.3)
1,893 (3.4)
Illicit drug use
189 (0.4)
37 (0.5)
226 (0.4)
Sexual and reproductive health
Unsafe sex
2,819 (5.8)
32 (0.4)
2,851 (5.1)
Nonuse and use of ineffective methods of
contraception
162 (0.3)
0 (0.0)
62 (0.3)
Environmental risks
Unsafe water, sanitation, and hygiene
1,563 (3.2)
4 (<0.1)
1,567 (2.8)
Urban air pollution
735 (1.5)
76 (1.0)
811 (1.4)
Indoor smoke from household use of solid fuels
1,791 (3.7)
0 (0.0)
1,791 (3.2)
Other selected risks
Contaminated injections in health care setting
407 (0.8)
4 (<0.1)
412 (0.7)
Child sexual abuse
65 (0.1)
6 (<0.1)
71 (0.1)
All selected risk factors together
22,014 (45.6)
3,473 (44.0)
25,488
(45.3)
Source: Adapted from [31]
a Age-standardized using the WHO World Standard Population
Air Quality Guidelines and Standards
15