

2017. Coal is the main fuel in the Asia Pacific
region, while natural gas dominates in CIS
(Commonwealth of Independent States) and the
Middle East accounting for over 50% total fuel
use [49]. Oil is the dominant fuel in the Americas,
Europe, and Africa [49]. On a global scale, oil,
coal, and natural gas are the top three consumed
fuels accounting for 34%, 28%, and 23% of the
total, respectively.
The Relationship Between per Capita GDP and
Energy Consumption
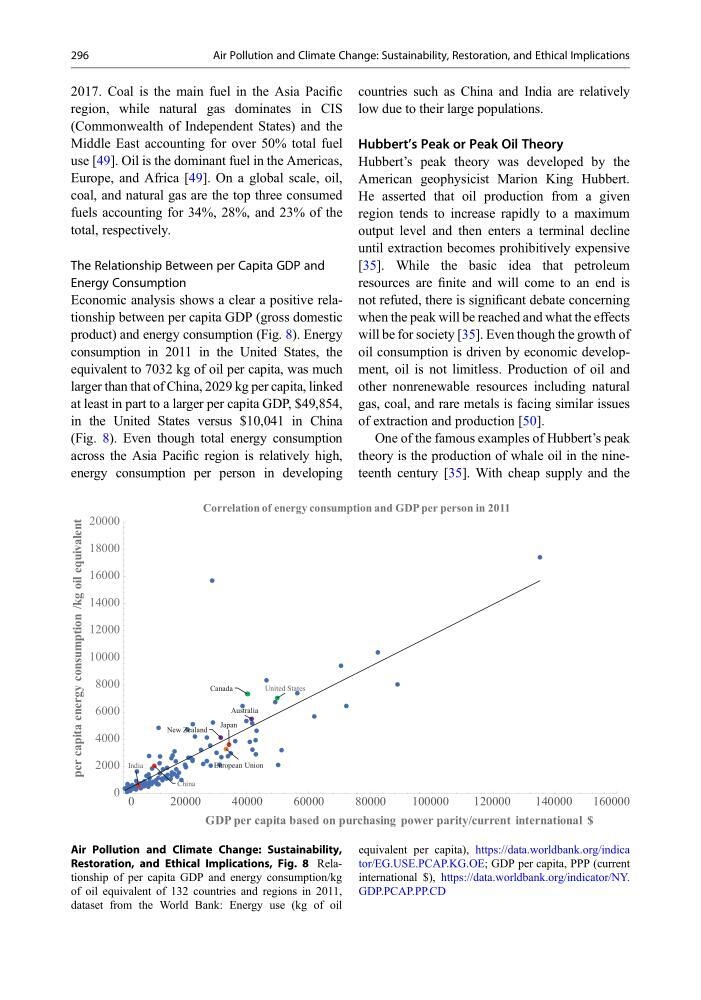
Economic analysis shows a clear a positive relationship between per capita GDP (gross domestic
product) and energy consumption (Fig. 8). Energy
consumption in 2011 in the United States, the
equivalent to 7032 kg of oil per capita, was much
larger than that of China, 2029 kg per capita, linked
at least in part to a larger per capita GDP, $49,854,
in the United States versus $10,041 in China
(Fig. 8). Even though total energy consumption
across the Asia Pacific region is relatively high,
energy consumption per person in developing
countries such as China and India are relatively
low due to their large populations.
Hubbert’s Peak or Peak Oil Theory
Hubbert’s peak theory was developed by the
American geophysicist Marion King Hubbert.
He asserted that oil production from a given
region tends to increase rapidly to a maximum
output level and then enters a terminal decline
until extraction becomes prohibitively expensive
[35]. While the basic idea that petroleum
resources are finite and will come to an end is
not refuted, there is significant debate concerning
when the peak will be reached and what the effects
will be for society [35]. Even though the growth of
oil consumption is driven by economic development, oil is not limitless. Production of oil and
other nonrenewable resources including natural
gas, coal, and rare metals is facing similar issues
of extraction and production [50].
One of the famous examples of Hubbert’s peak
theory is the production of whale oil in the nineteenth century [35]. With cheap supply and the
Canada
New Zealand
Australia
Japan
United States
European Union
India
China
0
2000
4000
6000
8000
10000
12000
14000
16000
18000
20000
0
20000
40000
60000
80000
100000
120000
140000
160000
per capita energy consumption /kg oil equivalent
GDP per capita based on purchasing power parity/current international $
Correlation of energy consumption and GDP per person in 2011
Air Pollution and Climate Change: Sustainability,
Restoration, and Ethical Implications, Fig. 8 Relationship of per capita GDP and energy consumption/kg
of oil equivalent of 132 countries and regions in 2011,
dataset from the World Bank: Energy use (kg of oil
equivalent per capita), https://data.worldbank.org/indica
tor/EG.USE.PCAP.KG.OE; GDP per capita, PPP (current
international $), https://data.worldbank.org/indicator/NY.
GDP.PCAP.PP.CD
296
Air Pollution and Climate Change: Sustainability, Restoration, and Ethical Implications
region, while natural gas dominates in CIS
(Commonwealth of Independent States) and the
Middle East accounting for over 50% total fuel
use [49]. Oil is the dominant fuel in the Americas,
Europe, and Africa [49]. On a global scale, oil,
coal, and natural gas are the top three consumed
fuels accounting for 34%, 28%, and 23% of the
total, respectively.
The Relationship Between per Capita GDP and
Energy Consumption
Economic analysis shows a clear a positive relationship between per capita GDP (gross domestic
product) and energy consumption (Fig. 8). Energy
consumption in 2011 in the United States, the
equivalent to 7032 kg of oil per capita, was much
larger than that of China, 2029 kg per capita, linked
at least in part to a larger per capita GDP, $49,854,
in the United States versus $10,041 in China
(Fig. 8). Even though total energy consumption
across the Asia Pacific region is relatively high,
energy consumption per person in developing
countries such as China and India are relatively
low due to their large populations.
Hubbert’s Peak or Peak Oil Theory
Hubbert’s peak theory was developed by the
American geophysicist Marion King Hubbert.
He asserted that oil production from a given
region tends to increase rapidly to a maximum
output level and then enters a terminal decline
until extraction becomes prohibitively expensive
[35]. While the basic idea that petroleum
resources are finite and will come to an end is
not refuted, there is significant debate concerning
when the peak will be reached and what the effects
will be for society [35]. Even though the growth of
oil consumption is driven by economic development, oil is not limitless. Production of oil and
other nonrenewable resources including natural
gas, coal, and rare metals is facing similar issues
of extraction and production [50].
One of the famous examples of Hubbert’s peak
theory is the production of whale oil in the nineteenth century [35]. With cheap supply and the
Canada
New Zealand
Australia
Japan
United States
European Union
India
China
0
2000
4000
6000
8000
10000
12000
14000
16000
18000
20000
0
20000
40000
60000
80000
100000
120000
140000
160000
per capita energy consumption /kg oil equivalent
GDP per capita based on purchasing power parity/current international $
Correlation of energy consumption and GDP per person in 2011
Air Pollution and Climate Change: Sustainability,
Restoration, and Ethical Implications, Fig. 8 Relationship of per capita GDP and energy consumption/kg
of oil equivalent of 132 countries and regions in 2011,
dataset from the World Bank: Energy use (kg of oil
equivalent per capita), https://data.worldbank.org/indica
tor/EG.USE.PCAP.KG.OE; GDP per capita, PPP (current
international $), https://data.worldbank.org/indicator/NY.
GDP.PCAP.PP.CD
296
Air Pollution and Climate Change: Sustainability, Restoration, and Ethical Implications