

Size range [μm]
4.0–8.0
2.0–4.0
1.0–2.0
0.5–1.0
0.25–0.5
0.125–0.25
0.06–0.125
4.0–8.0
2.0–4.0
1.0–2.0
0.5–1.0
0.25–0.5
0.125–0.25
0.06–0.125
4.0–8.0
2.0–4.0
1.0–2.0
0.5–1.0
0.25–0.5
0.125–0.25
0.06–0.125
4.0–8.0
2.0–4.0
1.0–2.0
0.5–1.0
0.25–0.5
0.125–0.25
0.06–0.125
4.0–8.0
2.0–4.0
1.0–2.0
0.5–1.0
0.25–0.5
0.125–0.25
0.06–0.125
4.0–8.0
2.0–4.0
1.0–2.0
0.5–1.0
0.25–0.5
0.125–0.25
0.06–0.125
0.0
0.2
0.4
0.6
0.8
1.0
1.2
1.4
0.0
1.0
2.0
3.0
4.0
5.0
6.0
7.0
0.0
0%
20%
40%
60%
80%
100%
SS
NO 3
nssSO 4
NH 4
MSA
non-MSA-WSOM
WIOM
0%
20%
40%
60%
80%
100%
0.5
1.0
1.5
2.0
2.5
3.0
Size range [μm]
Size range [μm]
Size range [μm]
Size range [μ
[
e
g
n
a
r
e
z
i
S
]
m
μm]
Mass contribution
Mass contribution
0%
20%
40%
60%
80%
100%
Mass contribution
μg m −3
μg m
−3
μg m
−3
mP
mA
cP
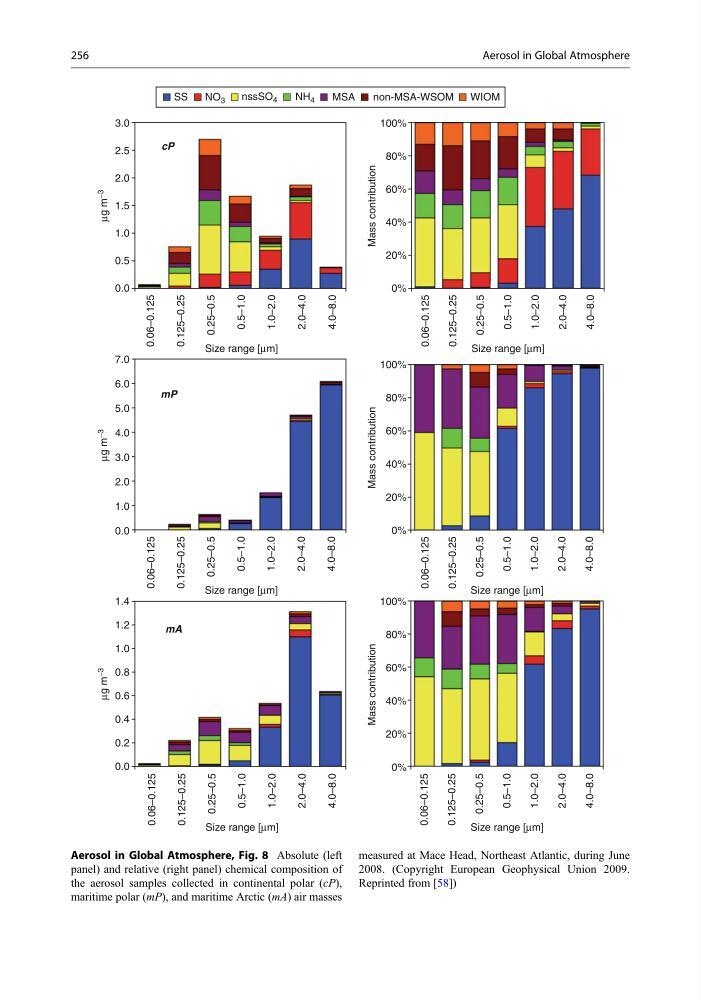
Aerosol in Global Atmosphere, Fig. 8 Absolute (left
panel) and relative (right panel) chemical composition of
the aerosol samples collected in continental polar (cP),
maritime polar (mP), and maritime Arctic (mA) air masses
measured at Mace Head, Northeast Atlantic, during June
2008. (Copyright European Geophysical Union 2009.
Reprinted from [58])
256
Aerosol in Global Atmosphere
4.0–8.0
2.0–4.0
1.0–2.0
0.5–1.0
0.25–0.5
0.125–0.25
0.06–0.125
4.0–8.0
2.0–4.0
1.0–2.0
0.5–1.0
0.25–0.5
0.125–0.25
0.06–0.125
4.0–8.0
2.0–4.0
1.0–2.0
0.5–1.0
0.25–0.5
0.125–0.25
0.06–0.125
4.0–8.0
2.0–4.0
1.0–2.0
0.5–1.0
0.25–0.5
0.125–0.25
0.06–0.125
4.0–8.0
2.0–4.0
1.0–2.0
0.5–1.0
0.25–0.5
0.125–0.25
0.06–0.125
4.0–8.0
2.0–4.0
1.0–2.0
0.5–1.0
0.25–0.5
0.125–0.25
0.06–0.125
0.0
0.2
0.4
0.6
0.8
1.0
1.2
1.4
0.0
1.0
2.0
3.0
4.0
5.0
6.0
7.0
0.0
0%
20%
40%
60%
80%
100%
SS
NO 3
nssSO 4
NH 4
MSA
non-MSA-WSOM
WIOM
0%
20%
40%
60%
80%
100%
0.5
1.0
1.5
2.0
2.5
3.0
Size range [μm]
Size range [μm]
Size range [μm]
Size range [μ
[
e
g
n
a
r
e
z
i
S
]
m
μm]
Mass contribution
Mass contribution
0%
20%
40%
60%
80%
100%
Mass contribution
μg m −3
μg m
−3
μg m
−3
mP
mA
cP
Aerosol in Global Atmosphere, Fig. 8 Absolute (left
panel) and relative (right panel) chemical composition of
the aerosol samples collected in continental polar (cP),
maritime polar (mP), and maritime Arctic (mA) air masses
measured at Mace Head, Northeast Atlantic, during June
2008. (Copyright European Geophysical Union 2009.
Reprinted from [58])
256
Aerosol in Global Atmosphere