

and international air quality standards and targets
have been established, by national governments,
the European Union (EU), and the World Health
Organization (WHO). Selected current standards
for key urban pollutants are summarized in
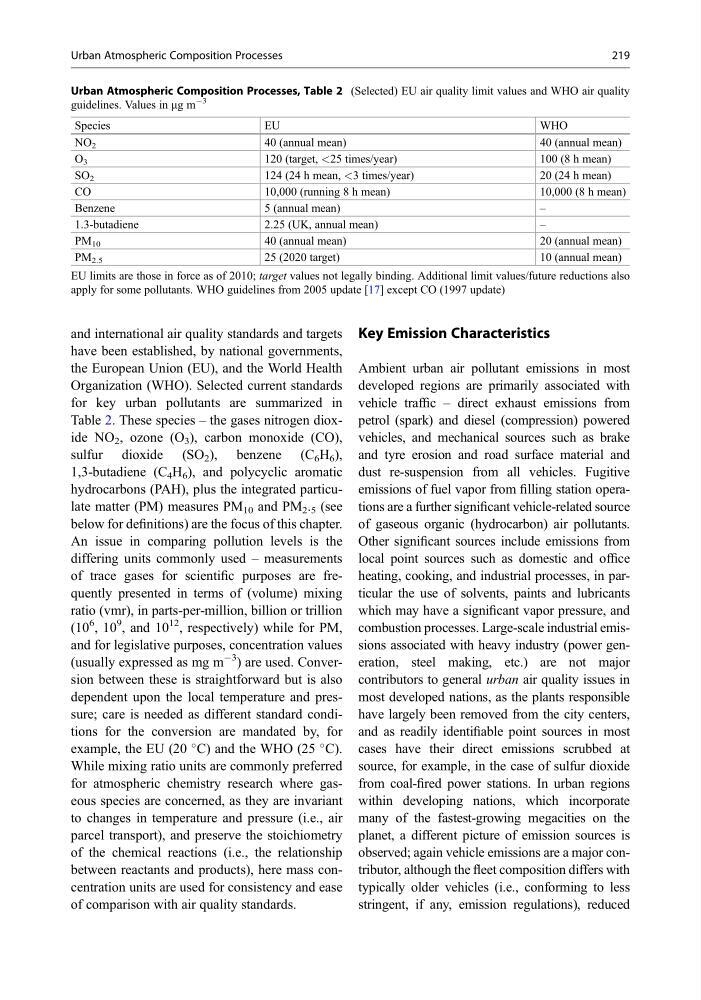
Table 2. These species – the gases nitrogen dioxide NO 2 , ozone (O 3 ), carbon monoxide (CO),
sulfur dioxide (SO 2 ), benzene (C 6 H 6 ),
1,3-butadiene (C 4 H 6 ), and polycyclic aromatic
hydrocarbons (PAH), plus the integrated particulate matter (PM) measures PM 10 and PM 2 . 5 (see
below for definitions) are the focus of this chapter.
An issue in comparing pollution levels is the
differing units commonly used – measurements
of trace gases for scientific purposes are frequently presented in terms of (volume) mixing
ratio (vmr), in parts-per-million, billion or trillion
(10
6 , 10
9 , and 10
12 , respectively) while for PM,
and for legislative purposes, concentration values
(usually expressed as mg m
À3 ) are used. Conversion between these is straightforward but is also
dependent upon the local temperature and pressure; care is needed as different standard conditions for the conversion are mandated by, for
example, the EU (20
C) and the WHO (25
C).
While mixing ratio units are commonly preferred
for atmospheric chemistry research where gaseous species are concerned, as they are invariant
to changes in temperature and pressure (i.e., air
parcel transport), and preserve the stoichiometry
of the chemical reactions (i.e., the relationship
between reactants and products), here mass concentration units are used for consistency and ease
of comparison with air quality standards.
Key Emission Characteristics
Ambient urban air pollutant emissions in most
developed regions are primarily associated with
vehicle traffic – direct exhaust emissions from
petrol (spark) and diesel (compression) powered
vehicles, and mechanical sources such as brake
and tyre erosion and road surface material and
dust re-suspension from all vehicles. Fugitive
emissions of fuel vapor from filling station operations are a further significant vehicle-related source
of gaseous organic (hydrocarbon) air pollutants.
Other significant sources include emissions from
local point sources such as domestic and office
heating, cooking, and industrial processes, in particular the use of solvents, paints and lubricants
which may have a significant vapor pressure, and
combustion processes. Large-scale industrial emissions associated with heavy industry (power generation, steel making, etc.) are not major
contributors to general urban air quality issues in
most developed nations, as the plants responsible
have largely been removed from the city centers,
and as readily identifiable point sources in most
cases have their direct emissions scrubbed at
source, for example, in the case of sulfur dioxide
from coal-fired power stations. In urban regions
within developing nations, which incorporate
many of the fastest-growing megacities on the
planet, a different picture of emission sources is
observed; again vehicle emissions are a major contributor, although the fleet composition differs with
typically older vehicles (i.e., conforming to less
stringent, if any, emission regulations), reduced
Urban Atmospheric Composition Processes, Table 2 (Selected) EU air quality limit values and WHO air quality
guidelines. Values in mg m
À3
Species
EU
WHO
NO 2
40 (annual mean)
40 (annual mean)
O 3
120 (target, <25 times/year)
100 (8 h mean)
SO 2
124 (24 h mean, <3 times/year)
20 (24 h mean)
CO
10,000 (running 8 h mean)
10,000 (8 h mean)
Benzene
5 (annual mean)
–
1.3-butadiene
2.25 (UK, annual mean)
–
PM 10
40 (annual mean)
20 (annual mean)
PM 2.5
25 (2020 target)
10 (annual mean)
EU limits are those in force as of 2010; target values not legally binding. Additional limit values/future reductions also
apply for some pollutants. WHO guidelines from 2005 update [17] except CO (1997 update)
Urban Atmospheric Composition Processes
219
have been established, by national governments,
the European Union (EU), and the World Health
Organization (WHO). Selected current standards
for key urban pollutants are summarized in
Table 2. These species – the gases nitrogen dioxide NO 2 , ozone (O 3 ), carbon monoxide (CO),
sulfur dioxide (SO 2 ), benzene (C 6 H 6 ),
1,3-butadiene (C 4 H 6 ), and polycyclic aromatic
hydrocarbons (PAH), plus the integrated particulate matter (PM) measures PM 10 and PM 2 . 5 (see
below for definitions) are the focus of this chapter.
An issue in comparing pollution levels is the
differing units commonly used – measurements
of trace gases for scientific purposes are frequently presented in terms of (volume) mixing
ratio (vmr), in parts-per-million, billion or trillion
(10
6 , 10
9 , and 10
12 , respectively) while for PM,
and for legislative purposes, concentration values
(usually expressed as mg m
À3 ) are used. Conversion between these is straightforward but is also
dependent upon the local temperature and pressure; care is needed as different standard conditions for the conversion are mandated by, for
example, the EU (20
C) and the WHO (25
C).
While mixing ratio units are commonly preferred
for atmospheric chemistry research where gaseous species are concerned, as they are invariant
to changes in temperature and pressure (i.e., air
parcel transport), and preserve the stoichiometry
of the chemical reactions (i.e., the relationship
between reactants and products), here mass concentration units are used for consistency and ease
of comparison with air quality standards.
Key Emission Characteristics
Ambient urban air pollutant emissions in most
developed regions are primarily associated with
vehicle traffic – direct exhaust emissions from
petrol (spark) and diesel (compression) powered
vehicles, and mechanical sources such as brake
and tyre erosion and road surface material and
dust re-suspension from all vehicles. Fugitive
emissions of fuel vapor from filling station operations are a further significant vehicle-related source
of gaseous organic (hydrocarbon) air pollutants.
Other significant sources include emissions from
local point sources such as domestic and office
heating, cooking, and industrial processes, in particular the use of solvents, paints and lubricants
which may have a significant vapor pressure, and
combustion processes. Large-scale industrial emissions associated with heavy industry (power generation, steel making, etc.) are not major
contributors to general urban air quality issues in
most developed nations, as the plants responsible
have largely been removed from the city centers,
and as readily identifiable point sources in most
cases have their direct emissions scrubbed at
source, for example, in the case of sulfur dioxide
from coal-fired power stations. In urban regions
within developing nations, which incorporate
many of the fastest-growing megacities on the
planet, a different picture of emission sources is
observed; again vehicle emissions are a major contributor, although the fleet composition differs with
typically older vehicles (i.e., conforming to less
stringent, if any, emission regulations), reduced
Urban Atmospheric Composition Processes, Table 2 (Selected) EU air quality limit values and WHO air quality
guidelines. Values in mg m
À3
Species
EU
WHO
NO 2
40 (annual mean)
40 (annual mean)
O 3
120 (target, <25 times/year)
100 (8 h mean)
SO 2
124 (24 h mean, <3 times/year)
20 (24 h mean)
CO
10,000 (running 8 h mean)
10,000 (8 h mean)
Benzene
5 (annual mean)
–
1.3-butadiene
2.25 (UK, annual mean)
–
PM 10
40 (annual mean)
20 (annual mean)
PM 2.5
25 (2020 target)
10 (annual mean)
EU limits are those in force as of 2010; target values not legally binding. Additional limit values/future reductions also
apply for some pollutants. WHO guidelines from 2005 update [17] except CO (1997 update)
Urban Atmospheric Composition Processes
219