

EU directives) and routinely measured at many
locations throughout the world. Particle mass is
dominated by particles >0.1 mm in diameter. Particles in traffic exhaust are mainly in the ultrafine
fraction and include elemental carbon (EC) as
well as organic carbon (OC) [37]. The ultrafine
mode particles from traffic sources contribute
considerably to the PM number concentrations
but only little to the PM mass.
While some health studies have demonstrated a
relationship between both acute and long-term
health effects and the ultrafine particle mode
(particle diameters <0.1 mm) [38], other studies
are less conclusive concerning the health effects
of the ultrafine mode particles. Even though ultrafine particles are a minor contribution to total particle mass concentration, they represent most of the
particles in terms of the number concentration.
Most studies to this point of the health effects air
particles have been related to particle mass. Neither
of the mechanisms are yet fully understood, and the
need for more studies has been called for [39].
With respect to streets with a high level of
vehicular traffic, a significant fraction of the particle pollution originates from this traffic [40]. The
direct emissions from car exhaust contain particles formed inside the engine as well as in the air
just after leaving the exhaust pipe. The latter
depend on the sulfur content in the fuel.
Studies have shown that reducing the sulfur
content in diesel significantly reduces the particle
number concentrations in urban streets, and this
parameter is therefore important for air quality
planning and management.
0
50
100
150
200
250
300
Jagtvej, Copenhagen
H.C.A. Boulevard, Cph
Banegaarsgade, Aarhus
Albanigade, Odense
Vesterbro, Aalborg
0
10
20
30
40
50
60
70
µg(NO
2 )/m 3
µg(NO
2 )/m 3
Urban Air Quality: Sources and Concentrations,
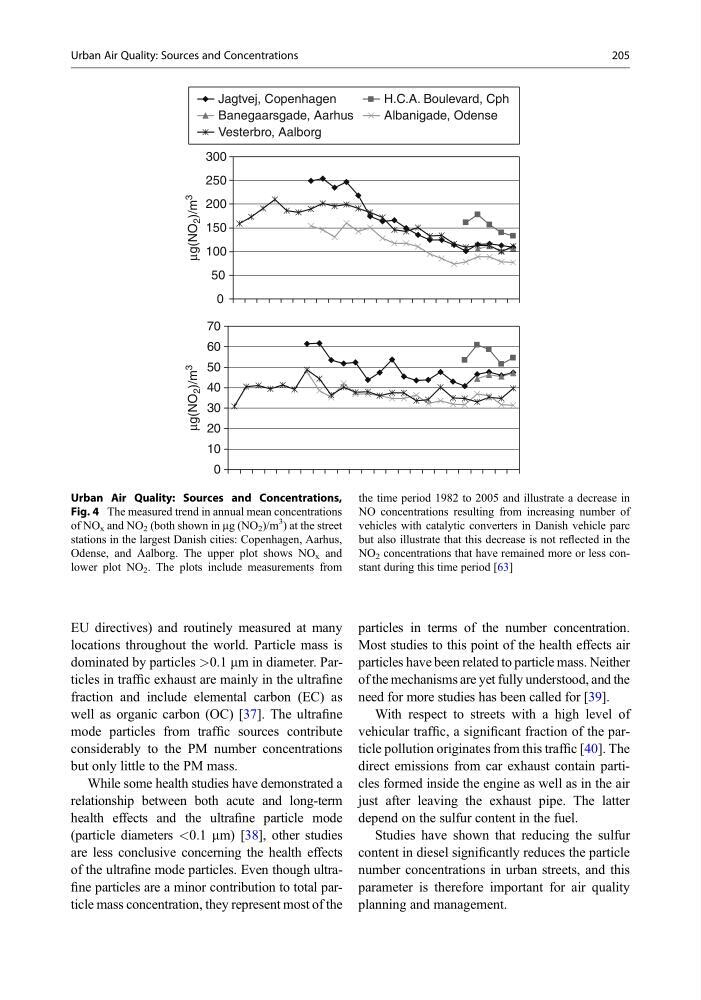
Fig. 4 The measured trend in annual mean concentrations
of NO x and NO 2 (both shown in mg (NO 2 )/m
3
) at the street
stations in the largest Danish cities: Copenhagen, Aarhus,
Odense, and Aalborg. The upper plot shows NO x and
lower plot NO 2 . The plots include measurements from
the time period 1982 to 2005 and illustrate a decrease in
NO concentrations resulting from increasing number of
vehicles with catalytic converters in Danish vehicle parc
but also illustrate that this decrease is not reflected in the
NO 2 concentrations that have remained more or less constant during this time period [63]
Urban Air Quality: Sources and Concentrations
205
locations throughout the world. Particle mass is
dominated by particles >0.1 mm in diameter. Particles in traffic exhaust are mainly in the ultrafine
fraction and include elemental carbon (EC) as
well as organic carbon (OC) [37]. The ultrafine
mode particles from traffic sources contribute
considerably to the PM number concentrations
but only little to the PM mass.
While some health studies have demonstrated a
relationship between both acute and long-term
health effects and the ultrafine particle mode
(particle diameters <0.1 mm) [38], other studies
are less conclusive concerning the health effects
of the ultrafine mode particles. Even though ultrafine particles are a minor contribution to total particle mass concentration, they represent most of the
particles in terms of the number concentration.
Most studies to this point of the health effects air
particles have been related to particle mass. Neither
of the mechanisms are yet fully understood, and the
need for more studies has been called for [39].
With respect to streets with a high level of
vehicular traffic, a significant fraction of the particle pollution originates from this traffic [40]. The
direct emissions from car exhaust contain particles formed inside the engine as well as in the air
just after leaving the exhaust pipe. The latter
depend on the sulfur content in the fuel.
Studies have shown that reducing the sulfur
content in diesel significantly reduces the particle
number concentrations in urban streets, and this
parameter is therefore important for air quality
planning and management.
0
50
100
150
200
250
300
Jagtvej, Copenhagen
H.C.A. Boulevard, Cph
Banegaarsgade, Aarhus
Albanigade, Odense
Vesterbro, Aalborg
0
10
20
30
40
50
60
70
µg(NO
2 )/m 3
µg(NO
2 )/m 3
Urban Air Quality: Sources and Concentrations,
Fig. 4 The measured trend in annual mean concentrations
of NO x and NO 2 (both shown in mg (NO 2 )/m
3
) at the street
stations in the largest Danish cities: Copenhagen, Aarhus,
Odense, and Aalborg. The upper plot shows NO x and
lower plot NO 2 . The plots include measurements from
the time period 1982 to 2005 and illustrate a decrease in
NO concentrations resulting from increasing number of
vehicles with catalytic converters in Danish vehicle parc
but also illustrate that this decrease is not reflected in the
NO 2 concentrations that have remained more or less constant during this time period [63]
Urban Air Quality: Sources and Concentrations
205