

Since many of us spend most of our time indoors,
indoor air quality is a major health concern and
may be worsened by the location of the office or
home in the urban environment.
The issue, as with case of ambient air quality, is
generally worse in the developing countries.
Emissions from household use of fossil fuels in
the year 2000 were estimated to account for
1.6 million deaths, mainly among women and
children in the poorest countries [9] that are
being exposed to elevated pollutant levels in the
indoor environment.
The actual ambient air pollutant load and therefore average air quality greatly vary from one city
to another, but, generally, major urban areas
throughout the world have poor air quality, and,
among these, the cities in the developing countries
face the greatest challenges.
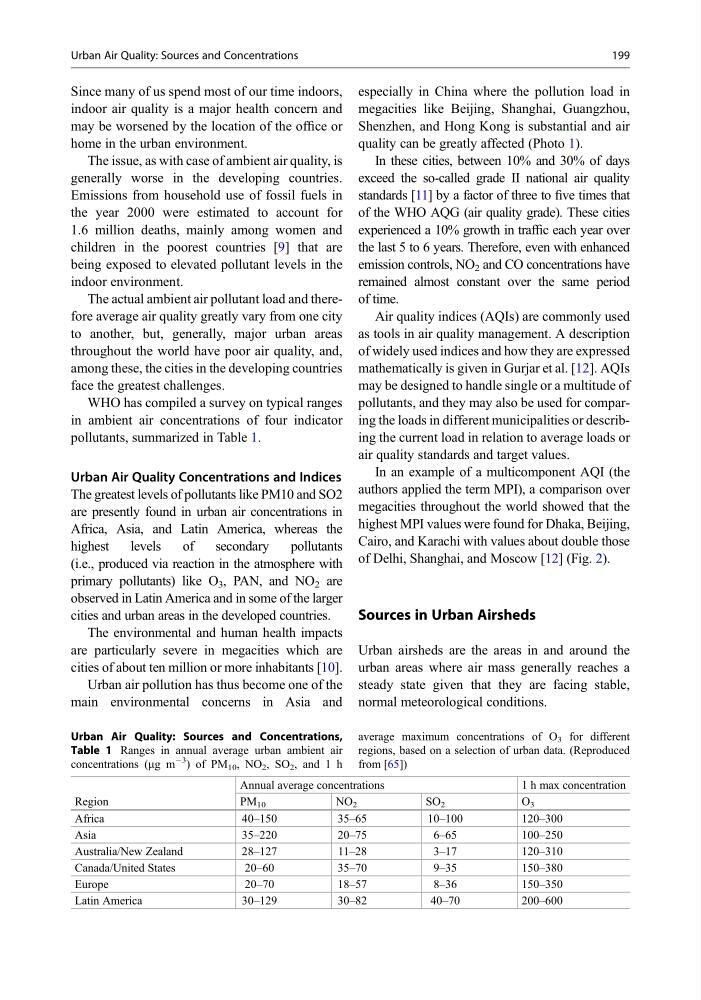
WHO has compiled a survey on typical ranges
in ambient air concentrations of four indicator
pollutants, summarized in Table 1.
Urban Air Quality Concentrations and Indices
The greatest levels of pollutants like PM10 and SO2
are presently found in urban air concentrations in
Africa, Asia, and Latin America, whereas the
highest
levels
of
secondary
pollutants
(i.e., produced via reaction in the atmosphere with
primary pollutants) like O 3 , PAN, and NO 2 are
observed in Latin America and in some of the larger
cities and urban areas in the developed countries.
The environmental and human health impacts
are particularly severe in megacities which are
cities of about ten million or more inhabitants [10].
Urban air pollution has thus become one of the
main environmental concerns in Asia and
especially in China where the pollution load in
megacities like Beijing, Shanghai, Guangzhou,
Shenzhen, and Hong Kong is substantial and air
quality can be greatly affected (Photo 1).
In these cities, between 10% and 30% of days
exceed the so-called grade II national air quality
standards [11] by a factor of three to five times that
of the WHO AQG (air quality grade). These cities
experienced a 10% growth in traffic each year over
the last 5 to 6 years. Therefore, even with enhanced
emission controls, NO 2 and CO concentrations have
remained almost constant over the same period
of time.
Air quality indices (AQIs) are commonly used
as tools in air quality management. A description
of widely used indices and how they are expressed
mathematically is given in Gurjar et al. [12]. AQIs
may be designed to handle single or a multitude of
pollutants, and they may also be used for comparing the loads in different municipalities or describing the current load in relation to average loads or
air quality standards and target values.
In an example of a multicomponent AQI (the
authors applied the term MPI), a comparison over
megacities throughout the world showed that the
highest MPI values were found for Dhaka, Beijing,
Cairo, and Karachi with values about double those
of Delhi, Shanghai, and Moscow [12] (Fig. 2).
Sources in Urban Airsheds
Urban airsheds are the areas in and around the
urban areas where air mass generally reaches a
steady state given that they are facing stable,
normal meteorological conditions.
Urban Air Quality: Sources and Concentrations,
Table 1 Ranges in annual average urban ambient air
concentrations (mg m
À3
) of PM 10 , NO 2 , SO 2 , and 1 h
average maximum concentrations of O 3 for different
regions, based on a selection of urban data. (Reproduced
from [65])
Region
Annual average concentrations
1 h max concentration
PM 10
NO 2
SO 2
O 3
Africa
40–150
35–65
10–100
120–300
Asia
35–220
20–75
6–65
100–250
Australia/New Zealand
28–127
11–28
3–17
120–310
Canada/United States
20–60
35–70
9–35
150–380
Europe
20–70
18–57
8–36
150–350
Latin America
30–129
30–82
40–70
200–600
Urban Air Quality: Sources and Concentrations
199
indoor air quality is a major health concern and
may be worsened by the location of the office or
home in the urban environment.
The issue, as with case of ambient air quality, is
generally worse in the developing countries.
Emissions from household use of fossil fuels in
the year 2000 were estimated to account for
1.6 million deaths, mainly among women and
children in the poorest countries [9] that are
being exposed to elevated pollutant levels in the
indoor environment.
The actual ambient air pollutant load and therefore average air quality greatly vary from one city
to another, but, generally, major urban areas
throughout the world have poor air quality, and,
among these, the cities in the developing countries
face the greatest challenges.
WHO has compiled a survey on typical ranges
in ambient air concentrations of four indicator
pollutants, summarized in Table 1.
Urban Air Quality Concentrations and Indices
The greatest levels of pollutants like PM10 and SO2
are presently found in urban air concentrations in
Africa, Asia, and Latin America, whereas the
highest
levels
of
secondary
pollutants
(i.e., produced via reaction in the atmosphere with
primary pollutants) like O 3 , PAN, and NO 2 are
observed in Latin America and in some of the larger
cities and urban areas in the developed countries.
The environmental and human health impacts
are particularly severe in megacities which are
cities of about ten million or more inhabitants [10].
Urban air pollution has thus become one of the
main environmental concerns in Asia and
especially in China where the pollution load in
megacities like Beijing, Shanghai, Guangzhou,
Shenzhen, and Hong Kong is substantial and air
quality can be greatly affected (Photo 1).
In these cities, between 10% and 30% of days
exceed the so-called grade II national air quality
standards [11] by a factor of three to five times that
of the WHO AQG (air quality grade). These cities
experienced a 10% growth in traffic each year over
the last 5 to 6 years. Therefore, even with enhanced
emission controls, NO 2 and CO concentrations have
remained almost constant over the same period
of time.
Air quality indices (AQIs) are commonly used
as tools in air quality management. A description
of widely used indices and how they are expressed
mathematically is given in Gurjar et al. [12]. AQIs
may be designed to handle single or a multitude of
pollutants, and they may also be used for comparing the loads in different municipalities or describing the current load in relation to average loads or
air quality standards and target values.
In an example of a multicomponent AQI (the
authors applied the term MPI), a comparison over
megacities throughout the world showed that the
highest MPI values were found for Dhaka, Beijing,
Cairo, and Karachi with values about double those
of Delhi, Shanghai, and Moscow [12] (Fig. 2).
Sources in Urban Airsheds
Urban airsheds are the areas in and around the
urban areas where air mass generally reaches a
steady state given that they are facing stable,
normal meteorological conditions.
Urban Air Quality: Sources and Concentrations,
Table 1 Ranges in annual average urban ambient air
concentrations (mg m
À3
) of PM 10 , NO 2 , SO 2 , and 1 h
average maximum concentrations of O 3 for different
regions, based on a selection of urban data. (Reproduced
from [65])
Region
Annual average concentrations
1 h max concentration
PM 10
NO 2
SO 2
O 3
Africa
40–150
35–65
10–100
120–300
Asia
35–220
20–75
6–65
100–250
Australia/New Zealand
28–127
11–28
3–17
120–310
Canada/United States
20–60
35–70
9–35
150–380
Europe
20–70
18–57
8–36
150–350
Latin America
30–129
30–82
40–70
200–600
Urban Air Quality: Sources and Concentrations
199