

reduction in wind speed as the surface is
approached can be equated to a transfer of momentum from the bulk fluid to the surface, caused by
the friction force. The momentum transfer
(transport) is large if the roughness is large.
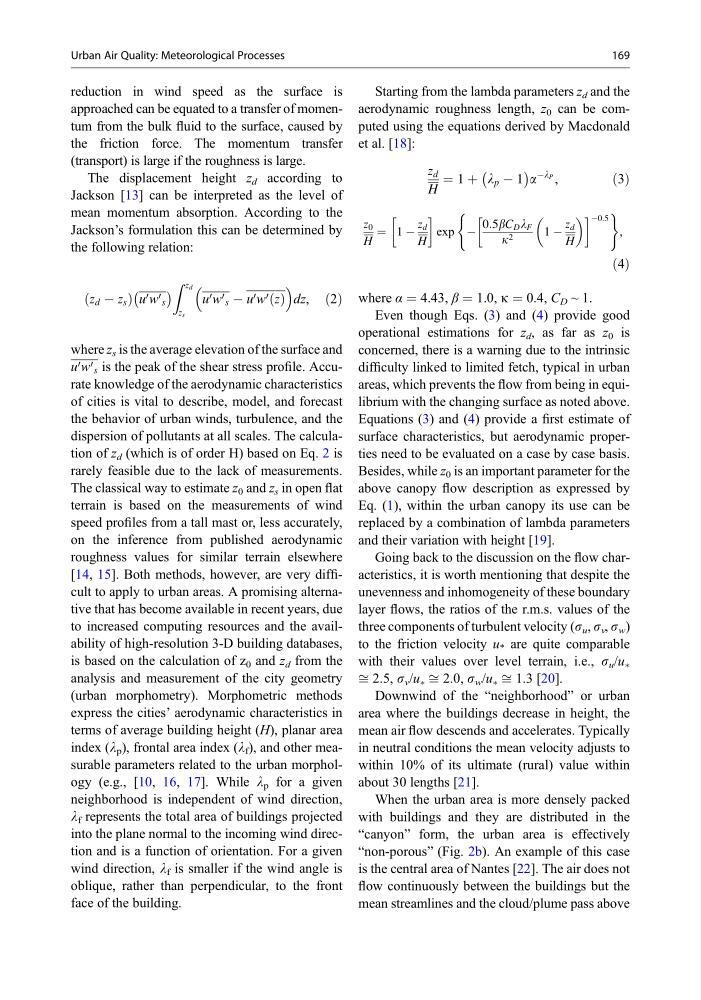
The displacement height z d according to
Jackson [13] can be interpreted as the level of
mean momentum absorption. According to the
Jackson’s formulation this can be determined by
the following relation:
z d À z s
ð
Þ u 0 w 0 s
À
Á
Z z d
z s
u 0 w 0 s À u 0 w 0 z
ð Þ
dz, ð2Þ
where z s is the average elevation of the surface and
u 0 w 0 s is the peak of the shear stress profile. Accurate knowledge of the aerodynamic characteristics
of cities is vital to describe, model, and forecast
the behavior of urban winds, turbulence, and the
dispersion of pollutants at all scales. The calculation of z d (which is of order H) based on Eq. 2 is
rarely feasible due to the lack of measurements.
The classical way to estimate z 0 and z s in open flat
terrain is based on the measurements of wind
speed profiles from a tall mast or, less accurately,
on the inference from published aerodynamic
roughness values for similar terrain elsewhere
[14, 15]. Both methods, however, are very difficult to apply to urban areas. A promising alternative that has become available in recent years, due
to increased computing resources and the availability of high-resolution 3-D building databases,
is based on the calculation of z 0 and z d from the
analysis and measurement of the city geometry
(urban morphometry). Morphometric methods
express the cities’ aerodynamic characteristics in
terms of average building height (H), planar area
index (l p ), frontal area index (l f ), and other measurable parameters related to the urban morphology (e.g., [10, 16, 17]. While l p for a given
neighborhood is independent of wind direction,
l f represents the total area of buildings projected
into the plane normal to the incoming wind direction and is a function of orientation. For a given
wind direction, l f is smaller if the wind angle is
oblique, rather than perpendicular, to the front
face of the building.
Starting from the lambda parameters z d and the
aerodynamic roughness length, z 0 can be computed using the equations derived by Macdonald
et al. [18]:
z d
H
¼ 1 þ l p À 1
À
Á a
Àl P ,
ð3Þ
z 0
H
¼ 1 À
z d
H
!
exp À
0:5bC D l F
k 2
1 À
z d
H
! À0:5
(
)
,
ð4Þ
where α ¼ 4.43, β ¼ 1.0, k ¼ 0.4, C D ~ 1.
Even though Eqs. (3) and (4) provide good
operational estimations for z d , as far as z 0 is
concerned, there is a warning due to the intrinsic
difficulty linked to limited fetch, typical in urban
areas, which prevents the flow from being in equilibrium with the changing surface as noted above.
Equations (3) and (4) provide a first estimate of
surface characteristics, but aerodynamic properties need to be evaluated on a case by case basis.
Besides, while z 0 is an important parameter for the
above canopy flow description as expressed by
Eq. (1), within the urban canopy its use can be
replaced by a combination of lambda parameters
and their variation with height [19].
Going back to the discussion on the flow characteristics, it is worth mentioning that despite the
unevenness and inhomogeneity of these boundary
layer flows, the ratios of the r.m.s. values of the
three components of turbulent velocity (s u , s v , s w )
to the friction velocity u * are quite comparable
with their values over level terrain, i.e., s u /u Ã
ffi 2.5, s v /u à ffi 2.0, s w /u à ffi 1.3 [20].
Downwind of the “neighborhood” or urban
area where the buildings decrease in height, the
mean air flow descends and accelerates. Typically
in neutral conditions the mean velocity adjusts to
within 10% of its ultimate (rural) value within
about 30 lengths [21].
When the urban area is more densely packed
with buildings and they are distributed in the
“canyon” form, the urban area is effectively
“non-porous” (Fig. 2b). An example of this case
is the central area of Nantes [22]. The air does not
flow continuously between the buildings but the
mean streamlines and the cloud/plume pass above
Urban Air Quality: Meteorological Processes
169
approached can be equated to a transfer of momentum from the bulk fluid to the surface, caused by
the friction force. The momentum transfer
(transport) is large if the roughness is large.
The displacement height z d according to
Jackson [13] can be interpreted as the level of
mean momentum absorption. According to the
Jackson’s formulation this can be determined by
the following relation:
z d À z s
ð
Þ u 0 w 0 s
À
Á
Z z d
z s
u 0 w 0 s À u 0 w 0 z
ð Þ
dz, ð2Þ
where z s is the average elevation of the surface and
u 0 w 0 s is the peak of the shear stress profile. Accurate knowledge of the aerodynamic characteristics
of cities is vital to describe, model, and forecast
the behavior of urban winds, turbulence, and the
dispersion of pollutants at all scales. The calculation of z d (which is of order H) based on Eq. 2 is
rarely feasible due to the lack of measurements.
The classical way to estimate z 0 and z s in open flat
terrain is based on the measurements of wind
speed profiles from a tall mast or, less accurately,
on the inference from published aerodynamic
roughness values for similar terrain elsewhere
[14, 15]. Both methods, however, are very difficult to apply to urban areas. A promising alternative that has become available in recent years, due
to increased computing resources and the availability of high-resolution 3-D building databases,
is based on the calculation of z 0 and z d from the
analysis and measurement of the city geometry
(urban morphometry). Morphometric methods
express the cities’ aerodynamic characteristics in
terms of average building height (H), planar area
index (l p ), frontal area index (l f ), and other measurable parameters related to the urban morphology (e.g., [10, 16, 17]. While l p for a given
neighborhood is independent of wind direction,
l f represents the total area of buildings projected
into the plane normal to the incoming wind direction and is a function of orientation. For a given
wind direction, l f is smaller if the wind angle is
oblique, rather than perpendicular, to the front
face of the building.
Starting from the lambda parameters z d and the
aerodynamic roughness length, z 0 can be computed using the equations derived by Macdonald
et al. [18]:
z d
H
¼ 1 þ l p À 1
À
Á a
Àl P ,
ð3Þ
z 0
H
¼ 1 À
z d
H
!
exp À
0:5bC D l F
k 2
1 À
z d
H
! À0:5
(
)
,
ð4Þ
where α ¼ 4.43, β ¼ 1.0, k ¼ 0.4, C D ~ 1.
Even though Eqs. (3) and (4) provide good
operational estimations for z d , as far as z 0 is
concerned, there is a warning due to the intrinsic
difficulty linked to limited fetch, typical in urban
areas, which prevents the flow from being in equilibrium with the changing surface as noted above.
Equations (3) and (4) provide a first estimate of
surface characteristics, but aerodynamic properties need to be evaluated on a case by case basis.
Besides, while z 0 is an important parameter for the
above canopy flow description as expressed by
Eq. (1), within the urban canopy its use can be
replaced by a combination of lambda parameters
and their variation with height [19].
Going back to the discussion on the flow characteristics, it is worth mentioning that despite the
unevenness and inhomogeneity of these boundary
layer flows, the ratios of the r.m.s. values of the
three components of turbulent velocity (s u , s v , s w )
to the friction velocity u * are quite comparable
with their values over level terrain, i.e., s u /u Ã
ffi 2.5, s v /u à ffi 2.0, s w /u à ffi 1.3 [20].
Downwind of the “neighborhood” or urban
area where the buildings decrease in height, the
mean air flow descends and accelerates. Typically
in neutral conditions the mean velocity adjusts to
within 10% of its ultimate (rural) value within
about 30 lengths [21].
When the urban area is more densely packed
with buildings and they are distributed in the
“canyon” form, the urban area is effectively
“non-porous” (Fig. 2b). An example of this case
is the central area of Nantes [22]. The air does not
flow continuously between the buildings but the
mean streamlines and the cloud/plume pass above
Urban Air Quality: Meteorological Processes
169