

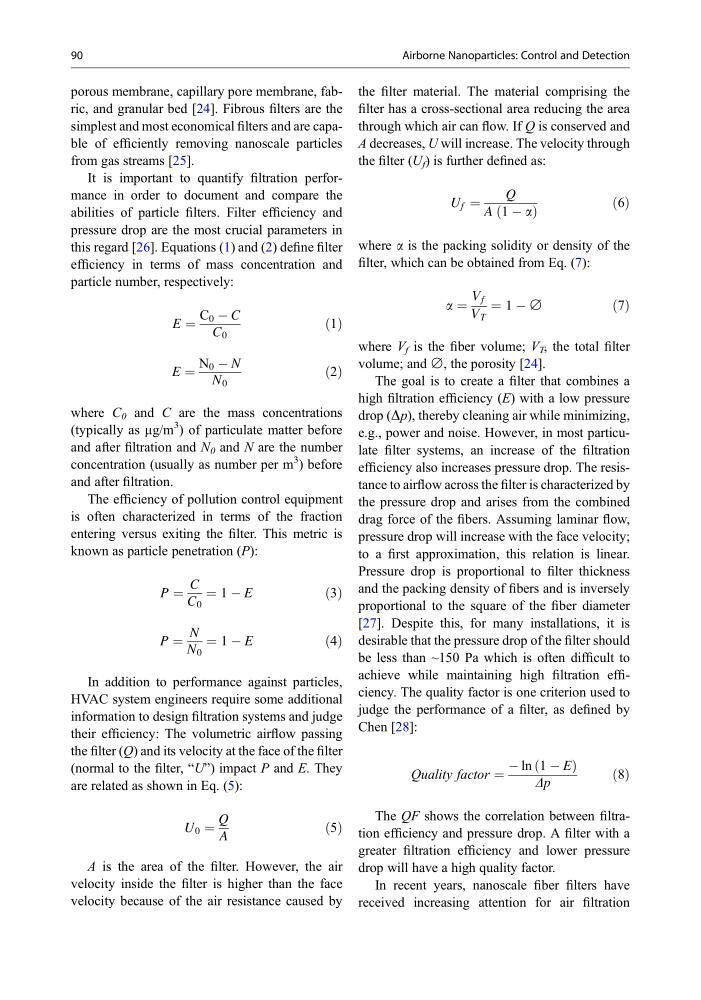
porous membrane, capillary pore membrane, fabric, and granular bed [24]. Fibrous filters are the
simplest and most economical filters and are capable of efficiently removing nanoscale particles
from gas streams [25].
It is important to quantify filtration performance in order to document and compare the
abilities of particle filters. Filter efficiency and
pressure drop are the most crucial parameters in
this regard [26]. Equations (1) and (2) define filter
efficiency in terms of mass concentration and
particle number, respectively:
E ¼
C 0 À C
C 0
ð1Þ
E ¼
N 0 À N
N 0
ð2Þ
where C 0 and C are the mass concentrations
(typically as mg/m
3 ) of particulate matter before
and after filtration and N 0 and N are the number
concentration (usually as number per m
3 ) before
and after filtration.
The efficiency of pollution control equipment
is often characterized in terms of the fraction
entering versus exiting the filter. This metric is
known as particle penetration (P):
P ¼
C
C 0
¼ 1 À E
ð3Þ
P ¼
N
N 0
¼ 1 À E
ð4Þ
In addition to performance against particles,
HVAC system engineers require some additional
information to design filtration systems and judge
their efficiency: The volumetric airflow passing
the filter (Q) and its velocity at the face of the filter
(normal to the filter, “U”) impact P and E. They
are related as shown in Eq. (5):
U 0 ¼
Q
A
ð5Þ
A is the area of the filter. However, the air
velocity inside the filter is higher than the face
velocity because of the air resistance caused by
the filter material. The material comprising the
filter has a cross-sectional area reducing the area
through which air can flow. If Q is conserved and
A decreases, U will increase. The velocity through
the filter (U f ) is further defined as:
U f ¼
Q
A 1 À a
ð
Þ
ð6Þ
where a is the packing solidity or density of the
filter, which can be obtained from Eq. (7):
a ¼
V f
V T
¼ 1 À ∅
ð7Þ
where V f is the fiber volume; V T , the total filter
volume; and ∅, the porosity [24].
The goal is to create a filter that combines a
high filtration efficiency (E) with a low pressure
drop (Dp), thereby cleaning air while minimizing,
e.g., power and noise. However, in most particulate filter systems, an increase of the filtration
efficiency also increases pressure drop. The resistance to airflow across the filter is characterized by
the pressure drop and arises from the combined
drag force of the fibers. Assuming laminar flow,
pressure drop will increase with the face velocity;
to a first approximation, this relation is linear.
Pressure drop is proportional to filter thickness
and the packing density of fibers and is inversely
proportional to the square of the fiber diameter
[27]. Despite this, for many installations, it is
desirable that the pressure drop of the filter should
be less than ~150 Pa which is often difficult to
achieve while maintaining high filtration efficiency. The quality factor is one criterion used to
judge the performance of a filter, as defined by
Chen [28]:
Quality factor ¼
À ln 1 À E
ð
Þ
Dp
ð8Þ
The QF shows the correlation between filtration efficiency and pressure drop. A filter with a
greater filtration efficiency and lower pressure
drop will have a high quality factor.
In recent years, nanoscale fiber filters have
received increasing attention for air filtration
90
Airborne Nanoparticles: Control and Detection
simplest and most economical filters and are capable of efficiently removing nanoscale particles
from gas streams [25].
It is important to quantify filtration performance in order to document and compare the
abilities of particle filters. Filter efficiency and
pressure drop are the most crucial parameters in
this regard [26]. Equations (1) and (2) define filter
efficiency in terms of mass concentration and
particle number, respectively:
E ¼
C 0 À C
C 0
ð1Þ
E ¼
N 0 À N
N 0
ð2Þ
where C 0 and C are the mass concentrations
(typically as mg/m
3 ) of particulate matter before
and after filtration and N 0 and N are the number
concentration (usually as number per m
3 ) before
and after filtration.
The efficiency of pollution control equipment
is often characterized in terms of the fraction
entering versus exiting the filter. This metric is
known as particle penetration (P):
P ¼
C
C 0
¼ 1 À E
ð3Þ
P ¼
N
N 0
¼ 1 À E
ð4Þ
In addition to performance against particles,
HVAC system engineers require some additional
information to design filtration systems and judge
their efficiency: The volumetric airflow passing
the filter (Q) and its velocity at the face of the filter
(normal to the filter, “U”) impact P and E. They
are related as shown in Eq. (5):
U 0 ¼
Q
A
ð5Þ
A is the area of the filter. However, the air
velocity inside the filter is higher than the face
velocity because of the air resistance caused by
the filter material. The material comprising the
filter has a cross-sectional area reducing the area
through which air can flow. If Q is conserved and
A decreases, U will increase. The velocity through
the filter (U f ) is further defined as:
U f ¼
Q
A 1 À a
ð
Þ
ð6Þ
where a is the packing solidity or density of the
filter, which can be obtained from Eq. (7):
a ¼
V f
V T
¼ 1 À ∅
ð7Þ
where V f is the fiber volume; V T , the total filter
volume; and ∅, the porosity [24].
The goal is to create a filter that combines a
high filtration efficiency (E) with a low pressure
drop (Dp), thereby cleaning air while minimizing,
e.g., power and noise. However, in most particulate filter systems, an increase of the filtration
efficiency also increases pressure drop. The resistance to airflow across the filter is characterized by
the pressure drop and arises from the combined
drag force of the fibers. Assuming laminar flow,
pressure drop will increase with the face velocity;
to a first approximation, this relation is linear.
Pressure drop is proportional to filter thickness
and the packing density of fibers and is inversely
proportional to the square of the fiber diameter
[27]. Despite this, for many installations, it is
desirable that the pressure drop of the filter should
be less than ~150 Pa which is often difficult to
achieve while maintaining high filtration efficiency. The quality factor is one criterion used to
judge the performance of a filter, as defined by
Chen [28]:
Quality factor ¼
À ln 1 À E
ð
Þ
Dp
ð8Þ
The QF shows the correlation between filtration efficiency and pressure drop. A filter with a
greater filtration efficiency and lower pressure
drop will have a high quality factor.
In recent years, nanoscale fiber filters have
received increasing attention for air filtration
90
Airborne Nanoparticles: Control and Detection