

208 unifying physics of accelerators, lasers and plasma
Therefore, our analysis should involve a spectrum that
depends on frequency as well as on wavenumber — a twodimensional power spectrum 8 P(ω, k).
The 2D spectrum (also called PWK spectrum) can evaluate expected relative displacements of two beamline elements, separated by a certain distance L and after a certain
time interval T . Assuming that at t = 0 the beamline was perfectly straight, the variance of the relative misalignment after
a time T of two points separated by the distance L is given by
+∞
2
dω dk
σ (T ,L)= P(ω, k) 4[1−cos(ωT )] [1−cos(kL)]
(10.26)
2π 2π
−∞
Since the formula Eq. 10.26 can predict the stability of any
two elements in our beamline, we can also evaluate the stability of the entire beamline by properly taking into account
all of the elements.
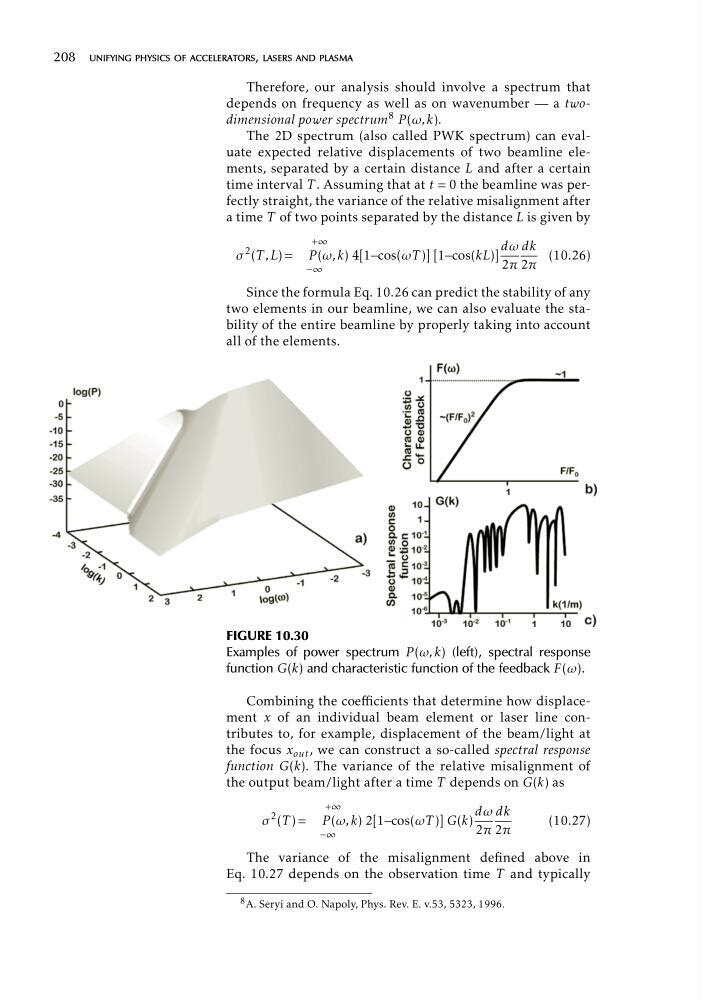
FIGURE 10.30
Examples of power spectrum P(ω, k) (left), spectral response
function G(k) and characteristic function of the feedback F(ω).
Combining the coefficients that determine how displacement x of an individual beam element or laser line contributes to, for example, displacement of the beam/light at
the focus x out , we can construct a so-called spectral response
function G(k). The variance of the relative misalignment of
the output beam/light after a time T depends on G(k) as
+
2
∞
dω dk
σ (T )= P(ω, k) 2[1−cos(ωT )] G(k)
(10.27)
2π 2π
−∞
The variance of the misalignment defined above in
Eq. 10.27 depends on the observation time T and typically
8 A. Seryi and O. Napoly, Phys. Rev. E. v.53, 5323, 1996.
Therefore, our analysis should involve a spectrum that
depends on frequency as well as on wavenumber — a twodimensional power spectrum 8 P(ω, k).
The 2D spectrum (also called PWK spectrum) can evaluate expected relative displacements of two beamline elements, separated by a certain distance L and after a certain
time interval T . Assuming that at t = 0 the beamline was perfectly straight, the variance of the relative misalignment after
a time T of two points separated by the distance L is given by
+∞
2
dω dk
σ (T ,L)= P(ω, k) 4[1−cos(ωT )] [1−cos(kL)]
(10.26)
2π 2π
−∞
Since the formula Eq. 10.26 can predict the stability of any
two elements in our beamline, we can also evaluate the stability of the entire beamline by properly taking into account
all of the elements.
FIGURE 10.30
Examples of power spectrum P(ω, k) (left), spectral response
function G(k) and characteristic function of the feedback F(ω).
Combining the coefficients that determine how displacement x of an individual beam element or laser line contributes to, for example, displacement of the beam/light at
the focus x out , we can construct a so-called spectral response
function G(k). The variance of the relative misalignment of
the output beam/light after a time T depends on G(k) as
+
2
∞
dω dk
σ (T )= P(ω, k) 2[1−cos(ωT )] G(k)
(10.27)
2π 2π
−∞
The variance of the misalignment defined above in
Eq. 10.27 depends on the observation time T and typically
8 A. Seryi and O. Napoly, Phys. Rev. E. v.53, 5323, 1996.