

24 Damage to concrete structures
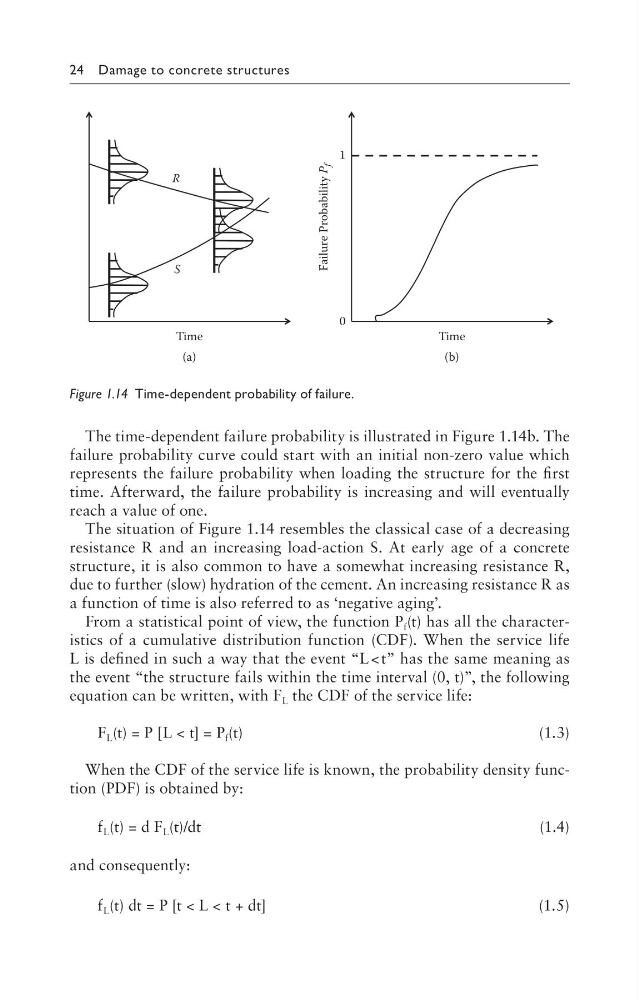
The time-dependent failure probability is illustrated in Figure 1.14b. The
failure probability curve could start with an initial non-zero value which
represents the failure probability when loading the structure for the first
time. Afterward, the failure probability is increasing and will eventually
reach a value of one.
The situation of Figure 1.14 resembles the classical case of a decreasing
resistance R and an increasing load-action S. At early age of a concrete
structure, it is also common to have a somewhat increasing resistance R,
due to further (slow) hydration of the cement. An increasing resistance R as
a function of time is also referred to as ‘negative aging’.
From a statistical point of view, the function P f (t) has all the characteristics of a cumulative distribution function (CDF). When the service life
L is defined in such a way that the event “L < t” has the same meaning as
the event “the structure fails within the time interval (0, t)”, the following
equation can be written, with F L the CDF of the service life:
F L (t) = P [L < t] = P f (t)
(1.3)
When the CDF of the service life is known, the probability density function (PDF) is obtained by:
f L (t) = d F L (t)/dt
(1.4)
and consequently:
f L (t) dt = P [t < L < t + dt]
(1.5)
Time
Failure Probability P
f
(b)
Time
0
1
S
R
(a)
Figure 1.14 Time-dependent probability of failure.
The time-dependent failure probability is illustrated in Figure 1.14b. The
failure probability curve could start with an initial non-zero value which
represents the failure probability when loading the structure for the first
time. Afterward, the failure probability is increasing and will eventually
reach a value of one.
The situation of Figure 1.14 resembles the classical case of a decreasing
resistance R and an increasing load-action S. At early age of a concrete
structure, it is also common to have a somewhat increasing resistance R,
due to further (slow) hydration of the cement. An increasing resistance R as
a function of time is also referred to as ‘negative aging’.
From a statistical point of view, the function P f (t) has all the characteristics of a cumulative distribution function (CDF). When the service life
L is defined in such a way that the event “L < t” has the same meaning as
the event “the structure fails within the time interval (0, t)”, the following
equation can be written, with F L the CDF of the service life:
F L (t) = P [L < t] = P f (t)
(1.3)
When the CDF of the service life is known, the probability density function (PDF) is obtained by:
f L (t) = d F L (t)/dt
(1.4)
and consequently:
f L (t) dt = P [t < L < t + dt]
(1.5)
Time
Failure Probability P
f
(b)
Time
0
1
S
R
(a)
Figure 1.14 Time-dependent probability of failure.