

Actions during service 157
salts. Furthermore, the molar volume of the salts is also a key parameter,
showing a better protective effect in the case of higher molar volume. Due
to the combination of low solubility of the salt and suitable molar volume,
the salt formation can seal the capillary pores, preventing or at least slowing further attack. The way the salt precipitates on the matrix, and the
salt’s affinity for the matrix are significant influential parameters (LarreurCayol et al. 2011).
As for the mechanism of acid attack, most typically a sequential process
is going on, as illustrated by the existence of different layers after some
period of exposure. In the bulk of the concrete, a sound zone is noticed,
with no signs of attack. More toward the surface, a first layer surrounding
the sound bulk material typically shows signs of decalcification. Depending
on the type of acid, other chemical changes can occur. In a second layer,
which is a thin outer surface layer, a more severe degradation can be
noticed, involving advanced dissolution of the C-S-H phase. The severely
degraded outer layer could easily be eroded by flowing water or by other
abrasive actions.
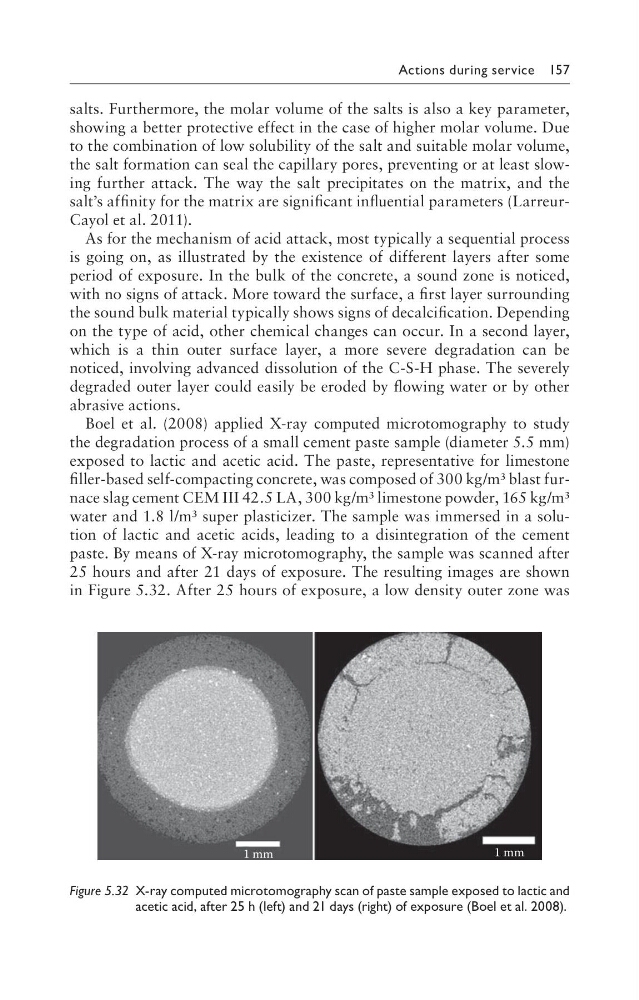
Boel et al. (2008) applied X-ray computed microtomography to study
the degradation process of a small cement paste sample (diameter 5.5 mm)
exposed to lactic and acetic acid. The paste, representative for limestone
filler-based self-compacting concrete, was composed of 300 kg/m³ blast furnace slag cement CEM III 42.5 LA, 300 kg/m³ limestone powder, 165 kg/ m³
water and 1.8 l/m³ super plasticizer. The sample was immersed in a solution of lactic and acetic acids, leading to a disintegration of the cement
paste. By means of X-ray microtomography, the sample was scanned after
25 hours and after 21 days of exposure. The resulting images are shown
in Figure 5.32. After 25 hours of exposure, a low density outer zone was
1 mm
1 mm
Figure 5.32 X-ray computed microtomography scan of paste sample exposed to lactic and
acetic acid, after 25 h (left) and 21 days (right) of exposure (Boel et al. 2008).
salts. Furthermore, the molar volume of the salts is also a key parameter,
showing a better protective effect in the case of higher molar volume. Due
to the combination of low solubility of the salt and suitable molar volume,
the salt formation can seal the capillary pores, preventing or at least slowing further attack. The way the salt precipitates on the matrix, and the
salt’s affinity for the matrix are significant influential parameters (LarreurCayol et al. 2011).
As for the mechanism of acid attack, most typically a sequential process
is going on, as illustrated by the existence of different layers after some
period of exposure. In the bulk of the concrete, a sound zone is noticed,
with no signs of attack. More toward the surface, a first layer surrounding
the sound bulk material typically shows signs of decalcification. Depending
on the type of acid, other chemical changes can occur. In a second layer,
which is a thin outer surface layer, a more severe degradation can be
noticed, involving advanced dissolution of the C-S-H phase. The severely
degraded outer layer could easily be eroded by flowing water or by other
abrasive actions.
Boel et al. (2008) applied X-ray computed microtomography to study
the degradation process of a small cement paste sample (diameter 5.5 mm)
exposed to lactic and acetic acid. The paste, representative for limestone
filler-based self-compacting concrete, was composed of 300 kg/m³ blast furnace slag cement CEM III 42.5 LA, 300 kg/m³ limestone powder, 165 kg/ m³
water and 1.8 l/m³ super plasticizer. The sample was immersed in a solution of lactic and acetic acids, leading to a disintegration of the cement
paste. By means of X-ray microtomography, the sample was scanned after
25 hours and after 21 days of exposure. The resulting images are shown
in Figure 5.32. After 25 hours of exposure, a low density outer zone was
1 mm
1 mm
Figure 5.32 X-ray computed microtomography scan of paste sample exposed to lactic and
acetic acid, after 25 h (left) and 21 days (right) of exposure (Boel et al. 2008).