

Use of GIS to Estimate Socioeconomic Losses Caused by Urban Floods: A Tool …
649
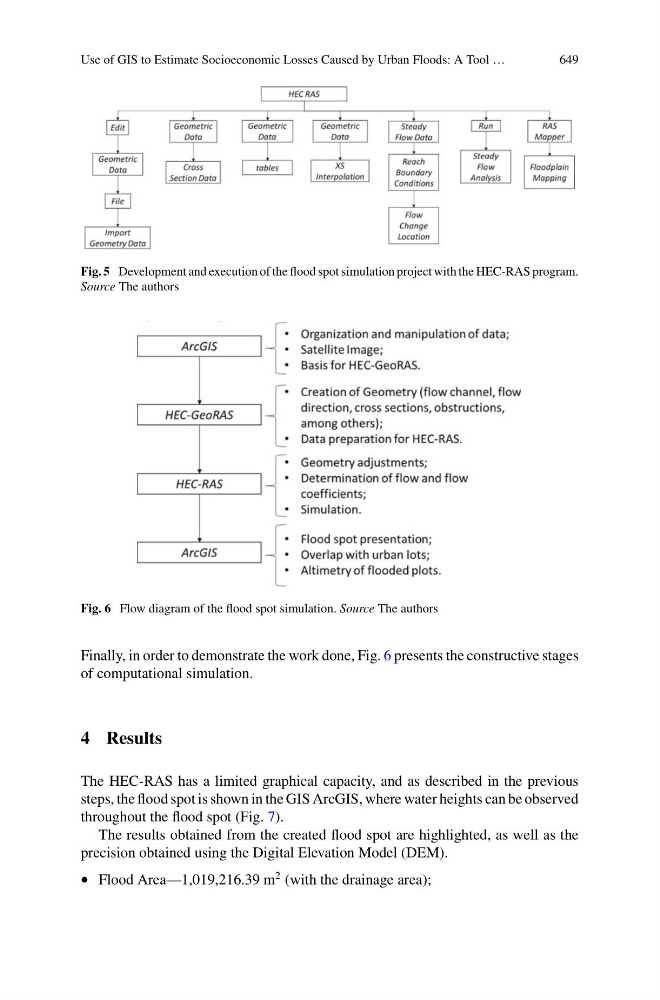
Fig. 5 Development and execution of the flood spot simulation project with the HEC-RAS program.
Source The authors
Fig. 6 Flow diagram of the flood spot simulation. Source The authors
Finally, in order to demonstrate the work done, Fig. 6 presents the constructive stages
of computational simulation.
4 Results
The HEC-RAS has a limited graphical capacity, and as described in the previous
steps, the flood spot is shown in the GIS ArcGIS, where water heights can be observed
throughout the flood spot (Fig. 7).
The results obtained from the created flood spot are highlighted, as well as the
precision obtained using the Digital Elevation Model (DEM).
• Flood Area—1,019,216.39 m
2 (with the drainage area);