

The Strategy of Social Responsibility at Universidad Pontificia Bolivariana …
445
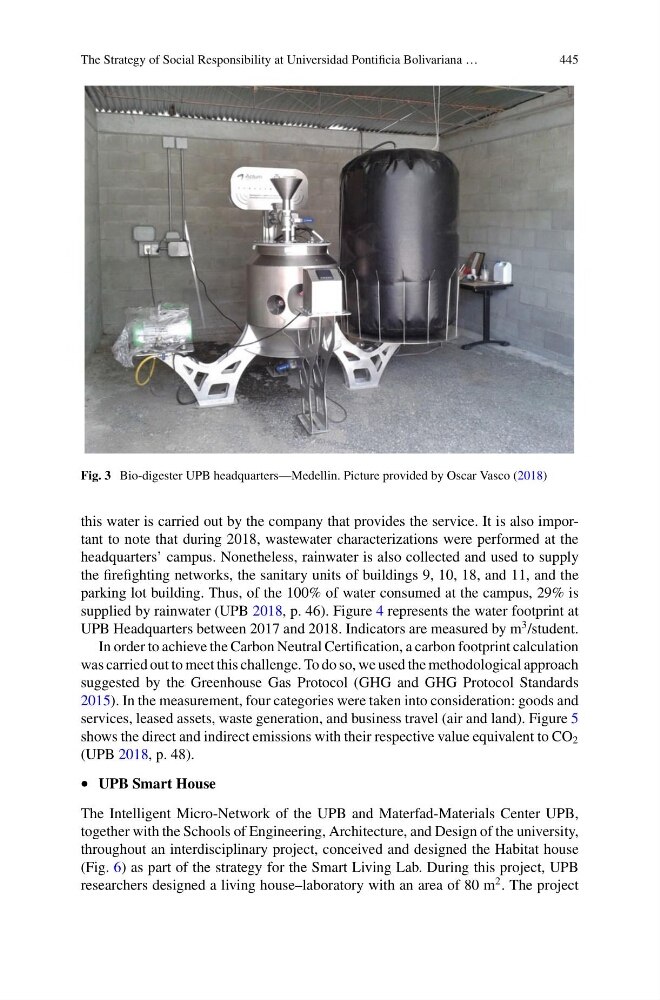
Fig. 3 Bio-digester UPB headquarters—Medellin. Picture provided by Oscar Vasco (2018)
this water is carried out by the company that provides the service. It is also important to note that during 2018, wastewater characterizations were performed at the
headquarters’ campus. Nonetheless, rainwater is also collected and used to supply
the firefighting networks, the sanitary units of buildings 9, 10, 18, and 11, and the
parking lot building. Thus, of the 100% of water consumed at the campus, 29% is
supplied by rainwater (UPB 2018, p. 46). Figure 4 represents the water footprint at
UPB Headquarters between 2017 and 2018. Indicators are measured by m
3 /student.
In order to achieve the Carbon Neutral Certification, a carbon footprint calculation
was carried out to meet this challenge. To do so, we used the methodological approach
suggested by the Greenhouse Gas Protocol (GHG and GHG Protocol Standards
2015). In the measurement, four categories were taken into consideration: goods and
services, leased assets, waste generation, and business travel (air and land). Figure 5
shows the direct and indirect emissions with their respective value equivalent to CO 2
(UPB 2018, p. 48).
• UPB Smart House
The Intelligent Micro-Network of the UPB and Materfad-Materials Center UPB,
together with the Schools of Engineering, Architecture, and Design of the university,
throughout an interdisciplinary project, conceived and designed the Habitat house
(Fig. 6) as part of the strategy for the Smart Living Lab. During this project, UPB
researchers designed a living house–laboratory with an area of 80 m
2 . The project
445
Fig. 3 Bio-digester UPB headquarters—Medellin. Picture provided by Oscar Vasco (2018)
this water is carried out by the company that provides the service. It is also important to note that during 2018, wastewater characterizations were performed at the
headquarters’ campus. Nonetheless, rainwater is also collected and used to supply
the firefighting networks, the sanitary units of buildings 9, 10, 18, and 11, and the
parking lot building. Thus, of the 100% of water consumed at the campus, 29% is
supplied by rainwater (UPB 2018, p. 46). Figure 4 represents the water footprint at
UPB Headquarters between 2017 and 2018. Indicators are measured by m
3 /student.
In order to achieve the Carbon Neutral Certification, a carbon footprint calculation
was carried out to meet this challenge. To do so, we used the methodological approach
suggested by the Greenhouse Gas Protocol (GHG and GHG Protocol Standards
2015). In the measurement, four categories were taken into consideration: goods and
services, leased assets, waste generation, and business travel (air and land). Figure 5
shows the direct and indirect emissions with their respective value equivalent to CO 2
(UPB 2018, p. 48).
• UPB Smart House
The Intelligent Micro-Network of the UPB and Materfad-Materials Center UPB,
together with the Schools of Engineering, Architecture, and Design of the university,
throughout an interdisciplinary project, conceived and designed the Habitat house
(Fig. 6) as part of the strategy for the Smart Living Lab. During this project, UPB
researchers designed a living house–laboratory with an area of 80 m
2 . The project