

416
T. L. Cruz
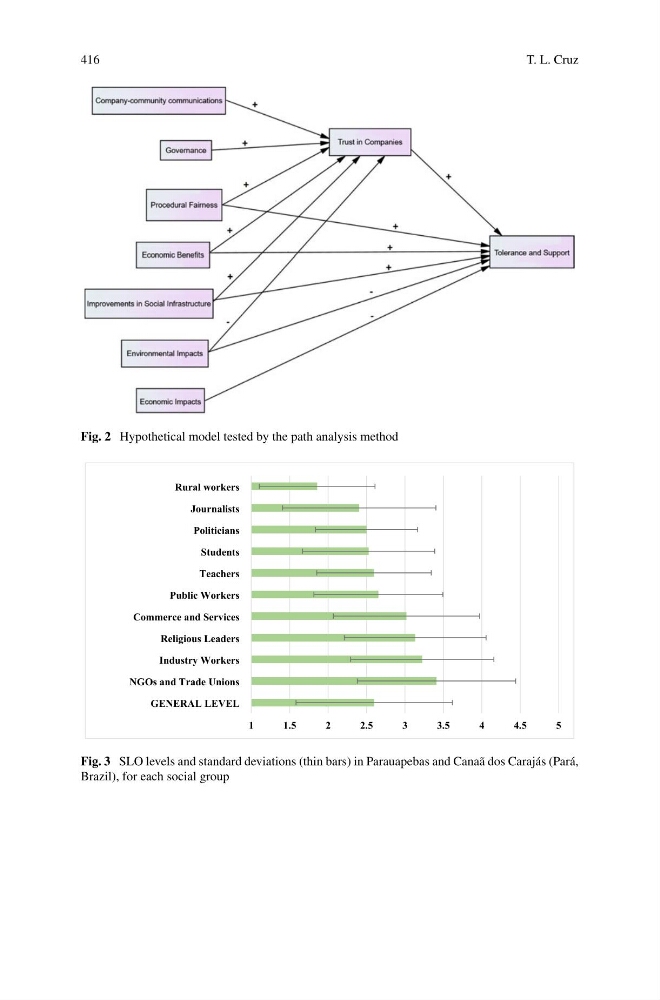
Fig. 2 Hypothetical model tested by the path analysis method
1
1 . 5
2
2 . 5
3
3 . 5
4
4 . 5
5
GENERAL LEVEL
NGOs and Trade Unions
Industry Workers
Religious Leaders
Commerce and Services
Public Workers
Teachers
Students
Politicians
Journalists
Rural workers
Fig. 3 SLO levels and standard deviations (thin bars) in Parauapebas and Canaã dos Carajás (Pará,
Brazil), for each social group
T. L. Cruz
Fig. 2 Hypothetical model tested by the path analysis method
1
1 . 5
2
2 . 5
3
3 . 5
4
4 . 5
5
GENERAL LEVEL
NGOs and Trade Unions
Industry Workers
Religious Leaders
Commerce and Services
Public Workers
Teachers
Students
Politicians
Journalists
Rural workers
Fig. 3 SLO levels and standard deviations (thin bars) in Parauapebas and Canaã dos Carajás (Pará,
Brazil), for each social group