

Production Performance Assessment at Different Levels …
361
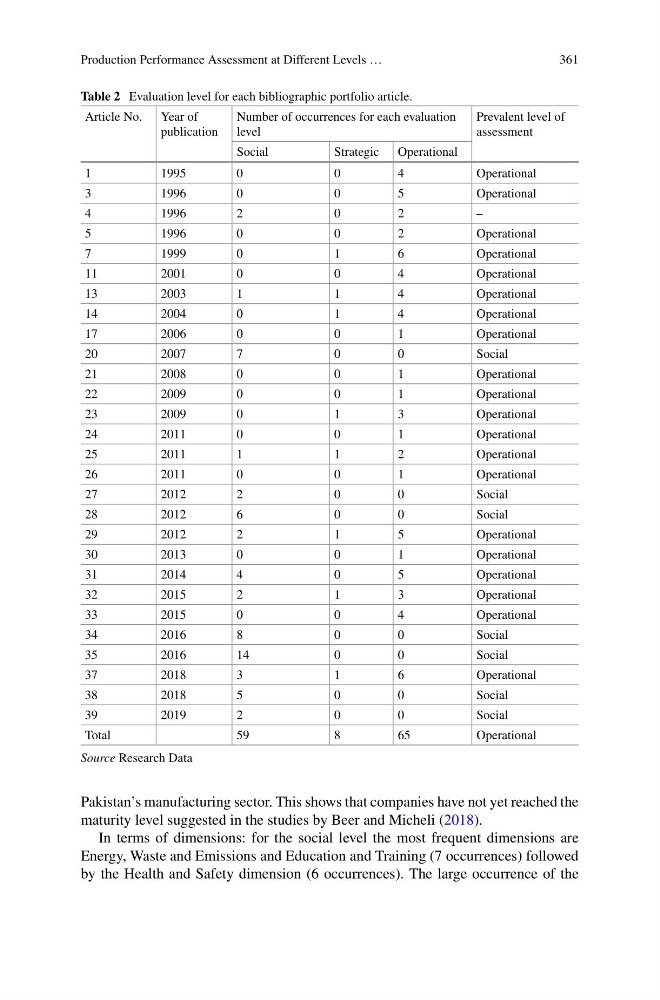
Table 2 Evaluation level for each bibliographic portfolio article.
Article No. Year of
publication
Number of occurrences for each evaluation
level
Prevalent level of
assessment
Social
Strategic Operational
1
1995
0
0
4
Operational
3
1996
0
0
5
Operational
4
1996
2
0
2
–
5
1996
0
0
2
Operational
7
1999
0
1
6
Operational
11
2001
0
0
4
Operational
13
2003
1
1
4
Operational
14
2004
0
1
4
Operational
17
2006
0
0
1
Operational
20
2007
7
0
0
Social
21
2008
0
0
1
Operational
22
2009
0
0
1
Operational
23
2009
0
1
3
Operational
24
2011
0
0
1
Operational
25
2011
1
1
2
Operational
26
2011
0
0
1
Operational
27
2012
2
0
0
Social
28
2012
6
0
0
Social
29
2012
2
1
5
Operational
30
2013
0
0
1
Operational
31
2014
4
0
5
Operational
32
2015
2
1
3
Operational
33
2015
0
0
4
Operational
34
2016
8
0
0
Social
35
2016
14
0
0
Social
37
2018
3
1
6
Operational
38
2018
5
0
0
Social
39
2019
2
0
0
Social
Total
59
8
65
Operational
Source Research Data
Pakistan’s manufacturing sector. This shows that companies have not yet reached the
maturity level suggested in the studies by Beer and Micheli (2018).
In terms of dimensions: for the social level the most frequent dimensions are
Energy, Waste and Emissions and Education and Training (7 occurrences) followed
by the Health and Safety dimension (6 occurrences). The large occurrence of the
361
Table 2 Evaluation level for each bibliographic portfolio article.
Article No. Year of
publication
Number of occurrences for each evaluation
level
Prevalent level of
assessment
Social
Strategic Operational
1
1995
0
0
4
Operational
3
1996
0
0
5
Operational
4
1996
2
0
2
–
5
1996
0
0
2
Operational
7
1999
0
1
6
Operational
11
2001
0
0
4
Operational
13
2003
1
1
4
Operational
14
2004
0
1
4
Operational
17
2006
0
0
1
Operational
20
2007
7
0
0
Social
21
2008
0
0
1
Operational
22
2009
0
0
1
Operational
23
2009
0
1
3
Operational
24
2011
0
0
1
Operational
25
2011
1
1
2
Operational
26
2011
0
0
1
Operational
27
2012
2
0
0
Social
28
2012
6
0
0
Social
29
2012
2
1
5
Operational
30
2013
0
0
1
Operational
31
2014
4
0
5
Operational
32
2015
2
1
3
Operational
33
2015
0
0
4
Operational
34
2016
8
0
0
Social
35
2016
14
0
0
Social
37
2018
3
1
6
Operational
38
2018
5
0
0
Social
39
2019
2
0
0
Social
Total
59
8
65
Operational
Source Research Data
Pakistan’s manufacturing sector. This shows that companies have not yet reached the
maturity level suggested in the studies by Beer and Micheli (2018).
In terms of dimensions: for the social level the most frequent dimensions are
Energy, Waste and Emissions and Education and Training (7 occurrences) followed
by the Health and Safety dimension (6 occurrences). The large occurrence of the