

Assessing the Use of Pine Chip Ash in Manufacturing …
235
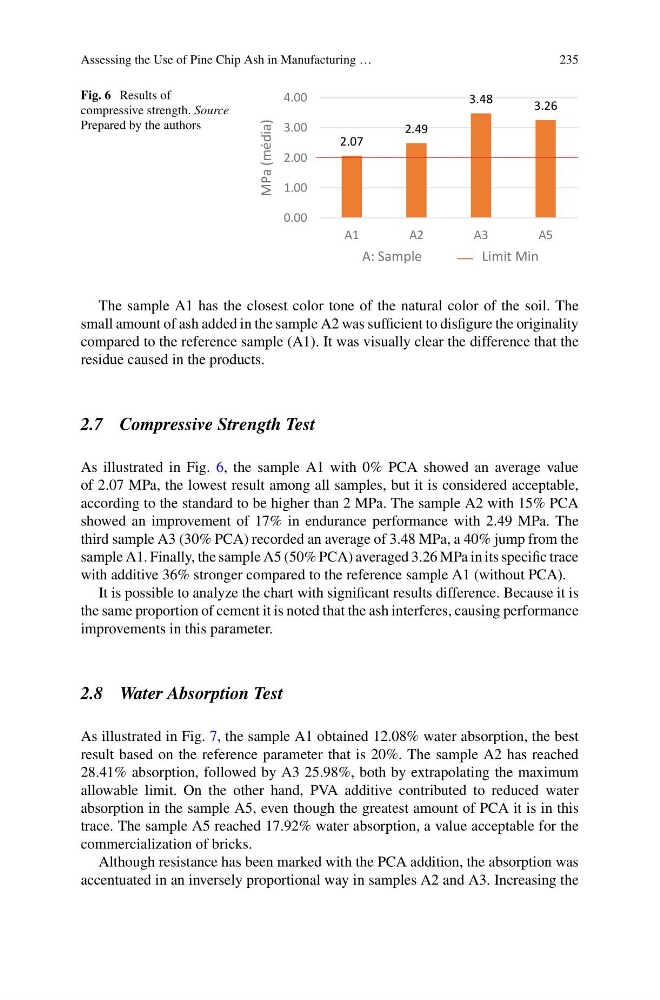
Fig. 6 Results of
compressive strength. Source
Prepared by the authors
2.07
2.49
3.48
3.26
0.00
1.00
2.00
3.00
4.00
A1
A2
A3
A5
MPa (média)
A: Sample
Limit Min
The sample A1 has the closest color tone of the natural color of the soil. The
small amount of ash added in the sample A2 was sufficient to disfigure the originality
compared to the reference sample (A1). It was visually clear the difference that the
residue caused in the products.
2.7 Compressive Strength Test
As illustrated in Fig. 6, the sample A1 with 0% PCA showed an average value
of 2.07 MPa, the lowest result among all samples, but it is considered acceptable,
according to the standard to be higher than 2 MPa. The sample A2 with 15% PCA
showed an improvement of 17% in endurance performance with 2.49 MPa. The
third sample A3 (30% PCA) recorded an average of 3.48 MPa, a 40% jump from the
sample A1. Finally, the sample A5 (50% PCA) averaged 3.26 MPa in its specific trace
with additive 36% stronger compared to the reference sample A1 (without PCA).
It is possible to analyze the chart with significant results difference. Because it is
the same proportion of cement it is noted that the ash interferes, causing performance
improvements in this parameter.
2.8 Water Absorption Test
As illustrated in Fig. 7, the sample A1 obtained 12.08% water absorption, the best
result based on the reference parameter that is 20%. The sample A2 has reached
28.41% absorption, followed by A3 25.98%, both by extrapolating the maximum
allowable limit. On the other hand, PVA additive contributed to reduced water
absorption in the sample A5, even though the greatest amount of PCA it is in this
trace. The sample A5 reached 17.92% water absorption, a value acceptable for the
commercialization of bricks.
Although resistance has been marked with the PCA addition, the absorption was
accentuated in an inversely proportional way in samples A2 and A3. Increasing the
235
Fig. 6 Results of
compressive strength. Source
Prepared by the authors
2.07
2.49
3.48
3.26
0.00
1.00
2.00
3.00
4.00
A1
A2
A3
A5
MPa (média)
A: Sample
Limit Min
The sample A1 has the closest color tone of the natural color of the soil. The
small amount of ash added in the sample A2 was sufficient to disfigure the originality
compared to the reference sample (A1). It was visually clear the difference that the
residue caused in the products.
2.7 Compressive Strength Test
As illustrated in Fig. 6, the sample A1 with 0% PCA showed an average value
of 2.07 MPa, the lowest result among all samples, but it is considered acceptable,
according to the standard to be higher than 2 MPa. The sample A2 with 15% PCA
showed an improvement of 17% in endurance performance with 2.49 MPa. The
third sample A3 (30% PCA) recorded an average of 3.48 MPa, a 40% jump from the
sample A1. Finally, the sample A5 (50% PCA) averaged 3.26 MPa in its specific trace
with additive 36% stronger compared to the reference sample A1 (without PCA).
It is possible to analyze the chart with significant results difference. Because it is
the same proportion of cement it is noted that the ash interferes, causing performance
improvements in this parameter.
2.8 Water Absorption Test
As illustrated in Fig. 7, the sample A1 obtained 12.08% water absorption, the best
result based on the reference parameter that is 20%. The sample A2 has reached
28.41% absorption, followed by A3 25.98%, both by extrapolating the maximum
allowable limit. On the other hand, PVA additive contributed to reduced water
absorption in the sample A5, even though the greatest amount of PCA it is in this
trace. The sample A5 reached 17.92% water absorption, a value acceptable for the
commercialization of bricks.
Although resistance has been marked with the PCA addition, the absorption was
accentuated in an inversely proportional way in samples A2 and A3. Increasing the