

Title Suppressed Due to Excessive Length
171
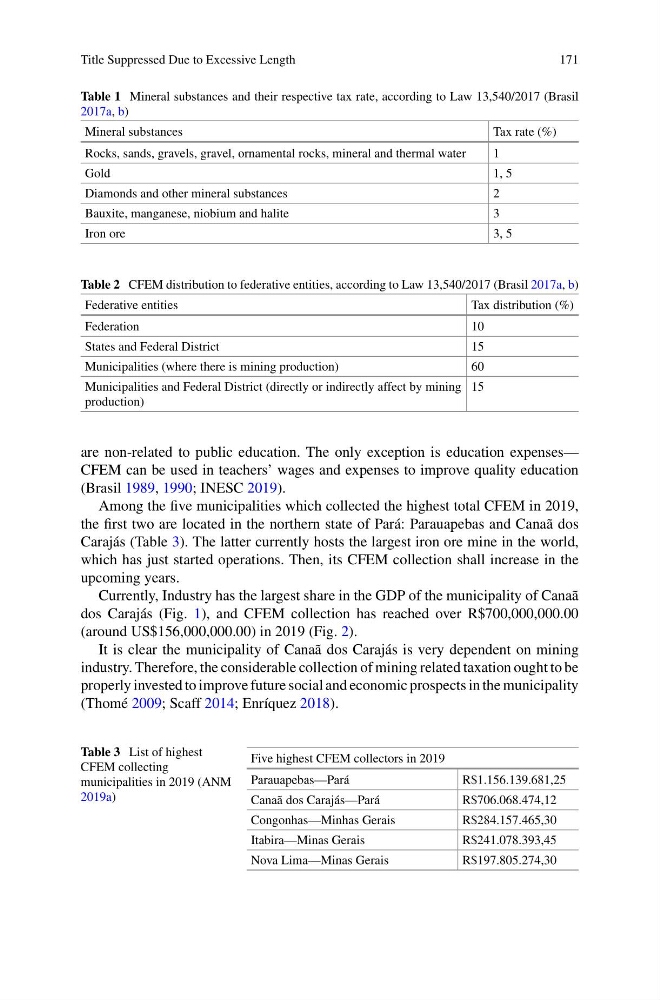
Table 1 Mineral substances and their respective tax rate, according to Law 13,540/2017 (Brasil
2017a, b)
Mineral substances
Tax rate (%)
Rocks, sands, gravels, gravel, ornamental rocks, mineral and thermal water
1
Gold
1, 5
Diamonds and other mineral substances
2
Bauxite, manganese, niobium and halite
3
Iron ore
3, 5
Table 2 CFEM distribution to federative entities, according to Law 13,540/2017 (Brasil 2017a, b)
Federative entities
Tax distribution (%)
Federation
10
States and Federal District
15
Municipalities (where there is mining production)
60
Municipalities and Federal District (directly or indirectly affect by mining
production)
15
are non-related to public education. The only exception is education expenses—
CFEM can be used in teachers’ wages and expenses to improve quality education
(Brasil 1989, 1990; INESC 2019).
Among the five municipalities which collected the highest total CFEM in 2019,
the first two are located in the northern state of Pará: Parauapebas and Canaã dos
Carajás (Table 3). The latter currently hosts the largest iron ore mine in the world,
which has just started operations. Then, its CFEM collection shall increase in the
upcoming years.
Currently, Industry has the largest share in the GDP of the municipality of Canaã
dos Carajás (Fig. 1), and CFEM collection has reached over R$700,000,000.00
(around US$156,000,000.00) in 2019 (Fig. 2).
It is clear the municipality of Canaã dos Carajás is very dependent on mining
industry. Therefore, the considerable collection of mining related taxation ought to be
properly invested to improve future social and economic prospects in the municipality
(Thomé 2009; Scaff 2014; Enríquez 2018).
Table 3 List of highest
CFEM collecting
municipalities in 2019 (ANM
2019a)
Five highest CFEM collectors in 2019
Parauapebas—Pará
R$1.156.139.681,25
Canaã dos Carajás—Pará
R$706.068.474,12
Congonhas—Minhas Gerais
R$284.157.465,30
Itabira—Minas Gerais
R$241.078.393,45
Nova Lima—Minas Gerais
R$197.805.274,30
171
Table 1 Mineral substances and their respective tax rate, according to Law 13,540/2017 (Brasil
2017a, b)
Mineral substances
Tax rate (%)
Rocks, sands, gravels, gravel, ornamental rocks, mineral and thermal water
1
Gold
1, 5
Diamonds and other mineral substances
2
Bauxite, manganese, niobium and halite
3
Iron ore
3, 5
Table 2 CFEM distribution to federative entities, according to Law 13,540/2017 (Brasil 2017a, b)
Federative entities
Tax distribution (%)
Federation
10
States and Federal District
15
Municipalities (where there is mining production)
60
Municipalities and Federal District (directly or indirectly affect by mining
production)
15
are non-related to public education. The only exception is education expenses—
CFEM can be used in teachers’ wages and expenses to improve quality education
(Brasil 1989, 1990; INESC 2019).
Among the five municipalities which collected the highest total CFEM in 2019,
the first two are located in the northern state of Pará: Parauapebas and Canaã dos
Carajás (Table 3). The latter currently hosts the largest iron ore mine in the world,
which has just started operations. Then, its CFEM collection shall increase in the
upcoming years.
Currently, Industry has the largest share in the GDP of the municipality of Canaã
dos Carajás (Fig. 1), and CFEM collection has reached over R$700,000,000.00
(around US$156,000,000.00) in 2019 (Fig. 2).
It is clear the municipality of Canaã dos Carajás is very dependent on mining
industry. Therefore, the considerable collection of mining related taxation ought to be
properly invested to improve future social and economic prospects in the municipality
(Thomé 2009; Scaff 2014; Enríquez 2018).
Table 3 List of highest
CFEM collecting
municipalities in 2019 (ANM
2019a)
Five highest CFEM collectors in 2019
Parauapebas—Pará
R$1.156.139.681,25
Canaã dos Carajás—Pará
R$706.068.474,12
Congonhas—Minhas Gerais
R$284.157.465,30
Itabira—Minas Gerais
R$241.078.393,45
Nova Lima—Minas Gerais
R$197.805.274,30