

Wavelength (μm)
3000
1000
300
100
30
Dose (W/cm
2
)
10
3
1
0.3
0.1
0.03
0.01
ED50 (measured JFEL)
ED50 model prediction
10
3
Extrapolated IR-B (ED50): H = 5.669−1.81d × t −0.794
1
ICNIRP (2006) (MPE): H = 2t
0.25 J/cm
2
EP & EU (MPE): H = 0.56t
0.25 J/cm
2
0.3
ANSI-Z136 (MPE): H = 0.56t 0.25 J/cm 2
0.1
0.03
IEEE (C95.1) ICNIRP (Guidelines 1997)
(PEL)
0.01
0.1
0.2 0.3
0.5
1
2
3
5
10
Frequency (THz)
epi
bm
d
sc
sl
sg
ss
sb
su
Subcutaneous
tissue
Artery
Vein
Lymph
vessel
n i = air
n t = tissue
θ i
θ r
θ t
Dermis
Epidermis
(a)
(b)
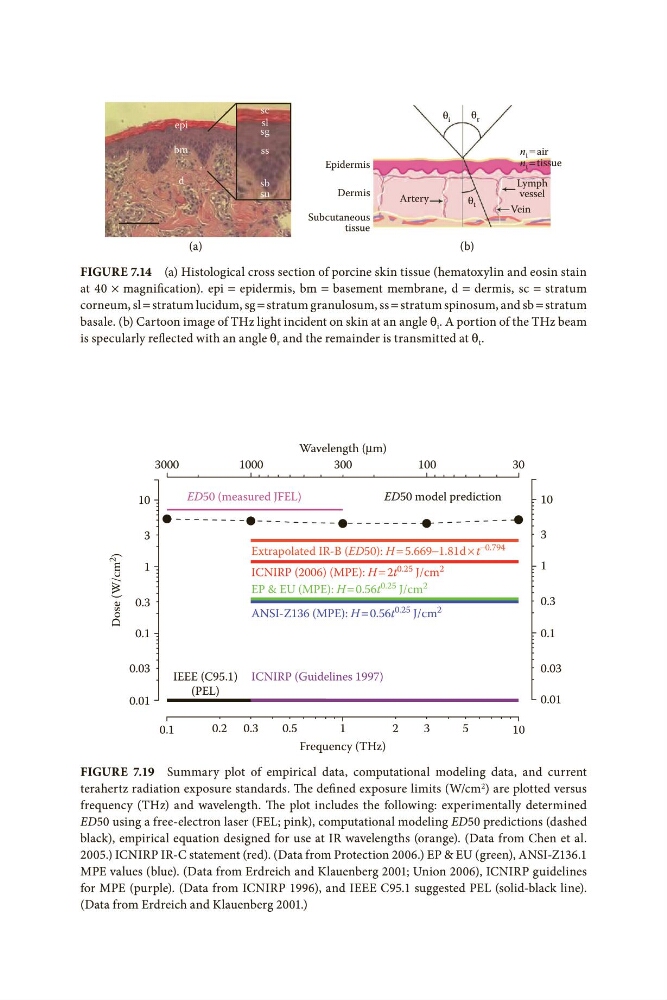
Figure 7.14 (a) Histological cross section of porcine skin tissue (hematoxylin and eosin stain
at 40 × magnification). epi = epidermis, bm = basement membrane, d = dermis, sc = stratum
corneum, sl = stratum lucidum, sg = stratum granulosum, ss = stratum spinosum, and sb = stratum
basale. (b) Cartoon image of THz light incident on skin at an angle θ i . A portion of the THz beam
is specularly reflected with an angle θ r and the remainder is transmitted at θ t .
Figure 7.19 Summary plot of empirical data, computational modeling data, and current
terahertz radiation exposure standards. The defined exposure limits (W/cm 2 ) are plotted versus
frequency (THz) and wavelength. The plot includes the following: experimentally determined
ED50 using a free-electron laser (FEL; pink), computational modeling ED50 predictions (dashed
black), empirical equation designed for use at IR wavelengths (orange). (Data from Chen et al.
2005.) ICNIRP IR-C statement (red). (Data from Protection 2006.) EP & EU (green), ANSI-Z136.1
MPE values (blue). (Data from Erdreich and Klauenberg 2001; Union 2006), ICNIRP guidelines
for MPE (purple). (Data from ICNIRP 1996), and IEEE C95.1 suggested PEL (solid-black line).
(Data from Erdreich and Klauenberg 2001.)
3000
1000
300
100
30
Dose (W/cm
2
)
10
3
1
0.3
0.1
0.03
0.01
ED50 (measured JFEL)
ED50 model prediction
10
3
Extrapolated IR-B (ED50): H = 5.669−1.81d × t −0.794
1
ICNIRP (2006) (MPE): H = 2t
0.25 J/cm
2
EP & EU (MPE): H = 0.56t
0.25 J/cm
2
0.3
ANSI-Z136 (MPE): H = 0.56t 0.25 J/cm 2
0.1
0.03
IEEE (C95.1) ICNIRP (Guidelines 1997)
(PEL)
0.01
0.1
0.2 0.3
0.5
1
2
3
5
10
Frequency (THz)
epi
bm
d
sc
sl
sg
ss
sb
su
Subcutaneous
tissue
Artery
Vein
Lymph
vessel
n i = air
n t = tissue
θ i
θ r
θ t
Dermis
Epidermis
(a)
(b)
Figure 7.14 (a) Histological cross section of porcine skin tissue (hematoxylin and eosin stain
at 40 × magnification). epi = epidermis, bm = basement membrane, d = dermis, sc = stratum
corneum, sl = stratum lucidum, sg = stratum granulosum, ss = stratum spinosum, and sb = stratum
basale. (b) Cartoon image of THz light incident on skin at an angle θ i . A portion of the THz beam
is specularly reflected with an angle θ r and the remainder is transmitted at θ t .
Figure 7.19 Summary plot of empirical data, computational modeling data, and current
terahertz radiation exposure standards. The defined exposure limits (W/cm 2 ) are plotted versus
frequency (THz) and wavelength. The plot includes the following: experimentally determined
ED50 using a free-electron laser (FEL; pink), computational modeling ED50 predictions (dashed
black), empirical equation designed for use at IR wavelengths (orange). (Data from Chen et al.
2005.) ICNIRP IR-C statement (red). (Data from Protection 2006.) EP & EU (green), ANSI-Z136.1
MPE values (blue). (Data from Erdreich and Klauenberg 2001; Union 2006), ICNIRP guidelines
for MPE (purple). (Data from ICNIRP 1996), and IEEE C95.1 suggested PEL (solid-black line).
(Data from Erdreich and Klauenberg 2001.)