

(a)
(b)
(c)
(d)
(e)
(f)
(g)
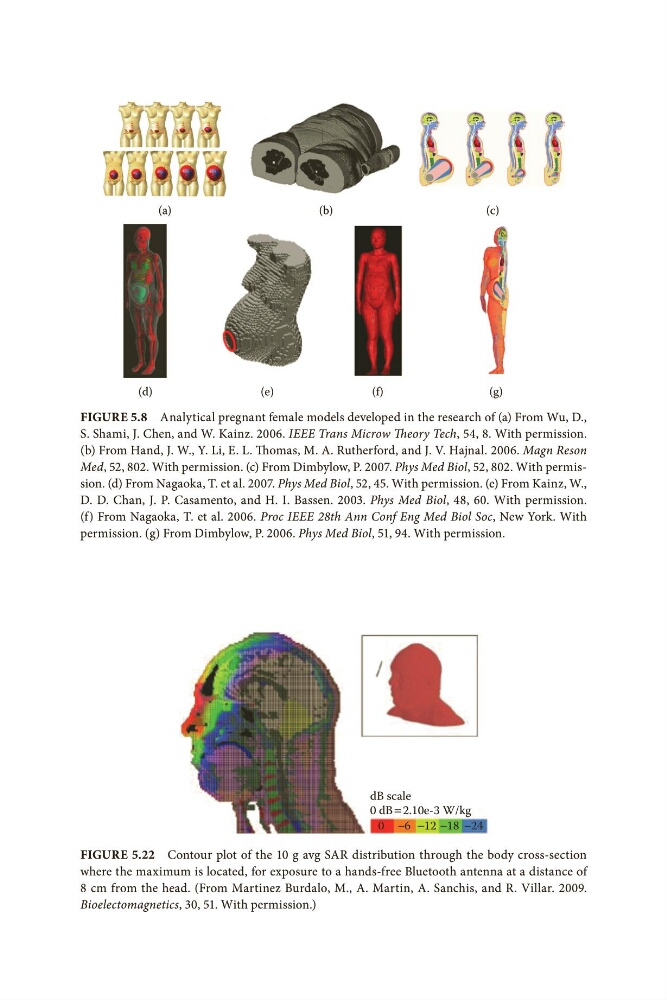
ure 5.8 Analytical pregnant female models developed in the research of (a) From Wu, D.,
hami, J. Chen, and W. Kainz. 2006. IEEE Trans Microw Theory Tech, 54, 8. With permission.
From Hand, J. W., Y. Li, E. L. Thomas, M. A. Rutherford, and J. V. Hajnal. 2006. Magn Reson
d, 52, 802. With permission. (c) From Dimbylow, P. 2007. Phys Med Biol, 52, 802. With permisn. (d) From Nagaoka, T. et al. 2007. Phys Med Biol, 52, 45. With permission. (e) From Kainz, W.,
D. Chan, J. P. Casamento, and H. I. Bassen. 2003. Phys Med Biol, 48, 60. With permission.
From Nagaoka, T. et al. 2006. Proc IEEE 28th Ann Conf Eng Med Biol Soc, New York. With
mission. (g) From Dimbylow, P. 2006. Phys Med Biol, 51, 94. With permission.
Fig
S. S
(b)
Me
sio
D.
(f)
per
dB scale
0 dB = 2.10e-3 W/kg
0 −6 −12 −18 −24
Figure 5.22 Contour plot of the 10 g avg SAR distribution through the body cross-section
where the maximum is located, for exposure to a hands-free Bluetooth antenna at a distance of
8 cm from the head. (From Martinez Burdalo, M., A. Martin, A. Sanchis, and R. Villar. 2009.
Bioelectomagnetics, 30, 51. With permission.)
(b)
(c)
(d)
(e)
(f)
(g)
ure 5.8 Analytical pregnant female models developed in the research of (a) From Wu, D.,
hami, J. Chen, and W. Kainz. 2006. IEEE Trans Microw Theory Tech, 54, 8. With permission.
From Hand, J. W., Y. Li, E. L. Thomas, M. A. Rutherford, and J. V. Hajnal. 2006. Magn Reson
d, 52, 802. With permission. (c) From Dimbylow, P. 2007. Phys Med Biol, 52, 802. With permisn. (d) From Nagaoka, T. et al. 2007. Phys Med Biol, 52, 45. With permission. (e) From Kainz, W.,
D. Chan, J. P. Casamento, and H. I. Bassen. 2003. Phys Med Biol, 48, 60. With permission.
From Nagaoka, T. et al. 2006. Proc IEEE 28th Ann Conf Eng Med Biol Soc, New York. With
mission. (g) From Dimbylow, P. 2006. Phys Med Biol, 51, 94. With permission.
Fig
S. S
(b)
Me
sio
D.
(f)
per
dB scale
0 dB = 2.10e-3 W/kg
0 −6 −12 −18 −24
Figure 5.22 Contour plot of the 10 g avg SAR distribution through the body cross-section
where the maximum is located, for exposure to a hands-free Bluetooth antenna at a distance of
8 cm from the head. (From Martinez Burdalo, M., A. Martin, A. Sanchis, and R. Villar. 2009.
Bioelectomagnetics, 30, 51. With permission.)