

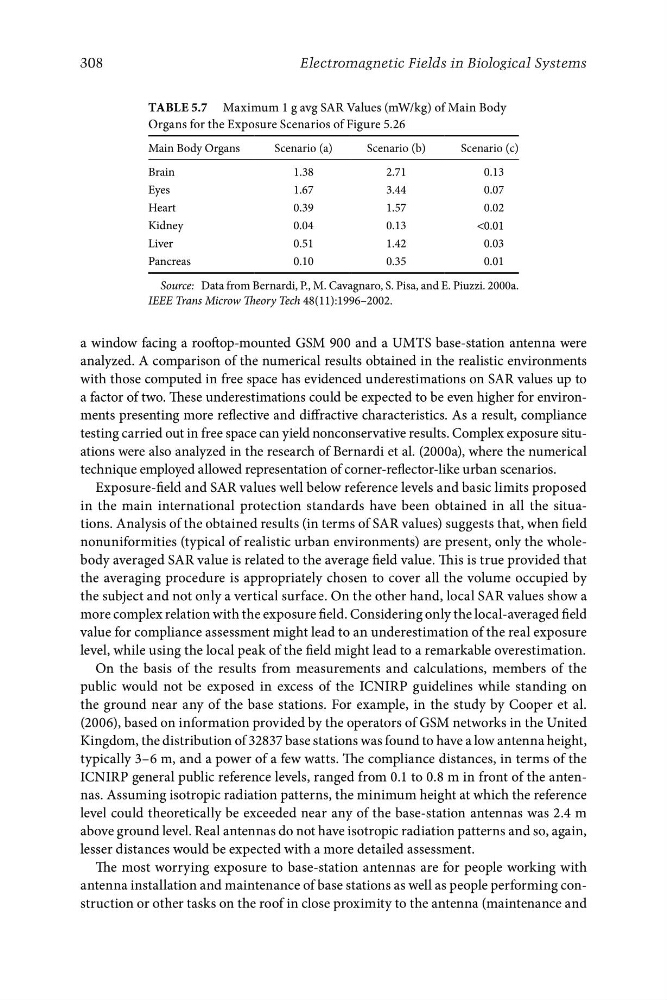
Table 5.7 Maximum 1 g avg SAR Values (mW/kg) of Main Body
Organs for the Exposure Scenarios of Figure 5.26
Main Body Organs
Scenario (a)
Scenario (b)
Scenario (c)
Brain
1.38
2.71
0.13
Eyes
1.67
3.44
0.07
Heart
0.39
1.57
0.02
Kidney
0.04
0.13
<0.01
Liver
0.51
1.42
0.03
Pancreas
0.10
0.35
0.01
Source: Data from Bernardi, P., M. Cavagnaro, S. Pisa, and E. Piuzzi. 2000a.
IEEE Trans Microw Theory Tech 48(11):1996–2002.
308
Electromagnetic Fields in Biological Systems
a window facing a rooftop-mounted GSM 900 and a UMTS base-station antenna were
analyzed. A comparison of the numerical results obtained in the realistic environments
with those computed in free space has evidenced underestimations on SAR values up to
a factor of two. These underestimations could be expected to be even higher for environments presenting more reflective and diffractive characteristics. As a result, compliance
testing carried out in free space can yield nonconservative results. Complex exposure situations were also analyzed in the research of Bernardi et al. (2000a), where the numerical
technique employed allowed representation of corner-reflector-like urban scenarios.
Exposure-field and SAR values well below reference levels and basic limits proposed
in the main international protection standards have been obtained in all the situations. Analysis of the obtained results (in terms of SAR values) suggests that, when field
nonuniformities (typical of realistic urban environments) are present, only the wholebody averaged SAR value is related to the average field value. This is true provided that
the averaging procedure is appropriately chosen to cover all the volume occupied by
the subject and not only a vertical surface. On the other hand, local SAR values show a
more complex relation with the exposure field. Considering only the local-averaged field
value for compliance assessment might lead to an underestimation of the real exposure
level, while using the local peak of the field might lead to a remarkable overestimation.
On the basis of the results from measurements and calculations, members of the
public would not be exposed in excess of the ICNIRP guidelines while standing on
the ground near any of the base stations. For example, in the study by Cooper et al.
(2006), based on information provided by the operators of GSM networks in the United
Kingdom, the distribution of 32837 base stations was found to have a low antenna height,
typically 3–6 m, and a power of a few watts. The compliance distances, in terms of the
ICNIRP general public reference levels, ranged from 0.1 to 0.8 m in front of the antennas. Assuming isotropic radiation patterns, the minimum height at which the reference
level could theoretically be exceeded near any of the base-station antennas was 2.4 m
above ground level. Real antennas do not have isotropic radiation patterns and so, again,
lesser distances would be expected with a more detailed assessment.
The most worrying exposure to base-station antennas are for people working with
antenna installation and maintenance of base stations as well as people performing construction or other tasks on the roof in close proximity to the antenna (maintenance and