

96
Electromagnetic Fields in Biological Systems
23
25
23
24
25
200 s
°C
°C
2
1
5 s
27
29
31
33
35
37
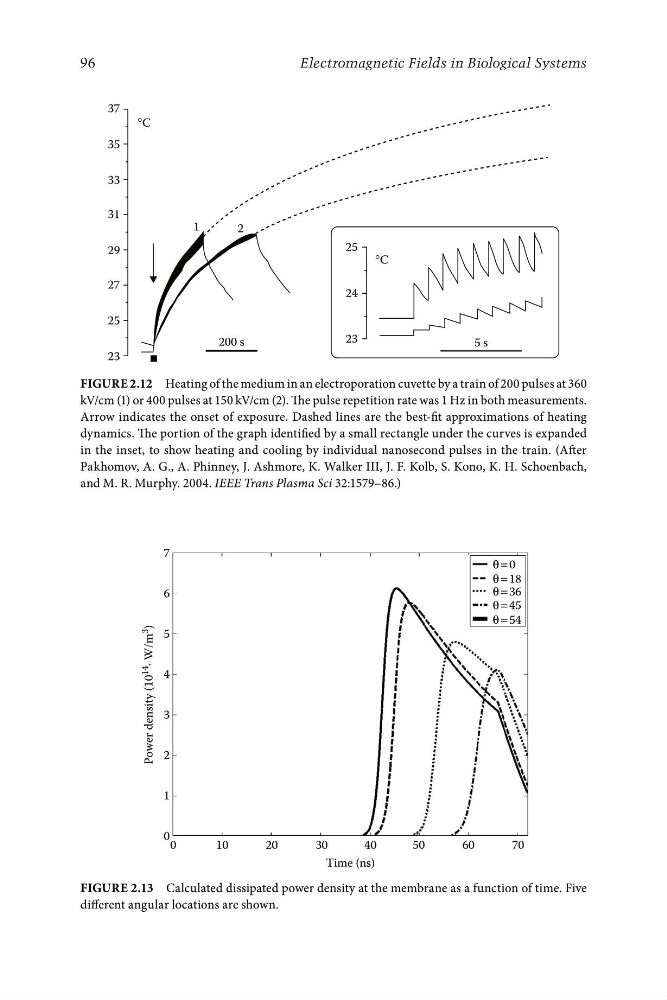
Figure 2.12 Heating of the medium in an electroporation cuvette by a train of 200 pulses at 360
kV/cm (1) or 400 pulses at 150 kV/cm (2). The pulse repetition rate was 1 Hz in both measurements.
Arrow indicates the onset of exposure. Dashed lines are the best-fit approximations of heating
dynamics. The portion of the graph identified by a small rectangle under the curves is expanded
in the inset, to show heating and cooling by individual nanosecond pulses in the train. (After
Pakhomov, A. G., A. Phinney, J. Ashmore, K. Walker III, J. F. Kolb, S. Kono, K. H. Schoenbach,
and M. R. Murphy. 2004. IEEE Trans Plasma Sci 32:1579–86.)
0
1
Power density (10
14
· W/m
3
)
2
3
5
6
7
4
θ = 0
θ = 18
θ = 36
θ = 45
θ = 54
0
10
20
30
40
50
60
70
Time (ns)
Figure 2.13 Calculated dissipated power density at the membrane as a function of time. Five
different angular locations are shown.
Electromagnetic Fields in Biological Systems
23
25
23
24
25
200 s
°C
°C
2
1
5 s
27
29
31
33
35
37
Figure 2.12 Heating of the medium in an electroporation cuvette by a train of 200 pulses at 360
kV/cm (1) or 400 pulses at 150 kV/cm (2). The pulse repetition rate was 1 Hz in both measurements.
Arrow indicates the onset of exposure. Dashed lines are the best-fit approximations of heating
dynamics. The portion of the graph identified by a small rectangle under the curves is expanded
in the inset, to show heating and cooling by individual nanosecond pulses in the train. (After
Pakhomov, A. G., A. Phinney, J. Ashmore, K. Walker III, J. F. Kolb, S. Kono, K. H. Schoenbach,
and M. R. Murphy. 2004. IEEE Trans Plasma Sci 32:1579–86.)
0
1
Power density (10
14
· W/m
3
)
2
3
5
6
7
4
θ = 0
θ = 18
θ = 36
θ = 45
θ = 54
0
10
20
30
40
50
60
70
Time (ns)
Figure 2.13 Calculated dissipated power density at the membrane as a function of time. Five
different angular locations are shown.