

Open-Loop Testing of Process Response ◾ 111
T28.3 and T63.2. The data taken are the time elapsed after the
step change in controller output for the process variable to
reach 28.3% and 63.2% of the steady-state change. The ADT
and TFO are calculated from Equations 10.3 and 10.4:
TFO = 1.5 (T63.2 − T28.3)
(10.3)
where:
TFO = first-order time constant (min)
T28.3 = time for PV to reach 28.3% of change to steady
state
T63.2 = time for PV to reach 63.2% of change to steady
state
ADT = T63.2 − TFO
(10.4)
where:
ADT = apparent dead time (min)
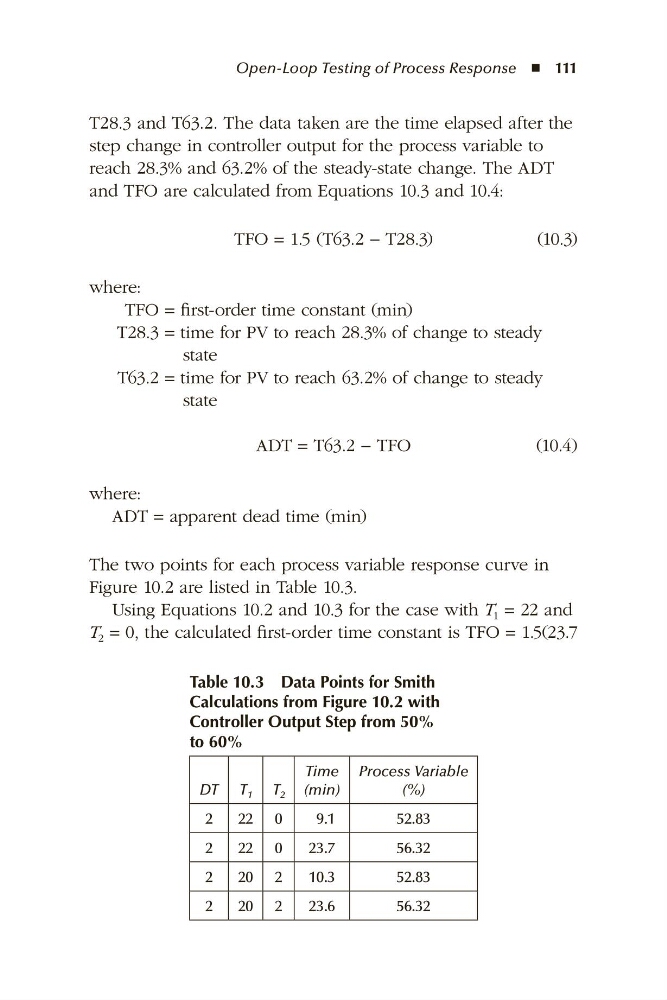
The two points for each process variable response curve in
Figure 10.2 are listed in Table 10.3.
Using Equations 10.2 and 10.3 for the case with T 1 = 22 and
T 2 = 0, the calculated first-order time constant is TFO = 1.5(23.7
Table 10.3 Data Points for Smith
Calculations from Figure 10.2 with
Controller Output Step from 50%
to 60%
DT T 1 T 2
Time
(min)
Process Variable
(%)
2
22 0
9.1
52.83
2
22 0
23.7
56.32
2
20 2
10.3
52.83
2
20 2
23.6
56.32