

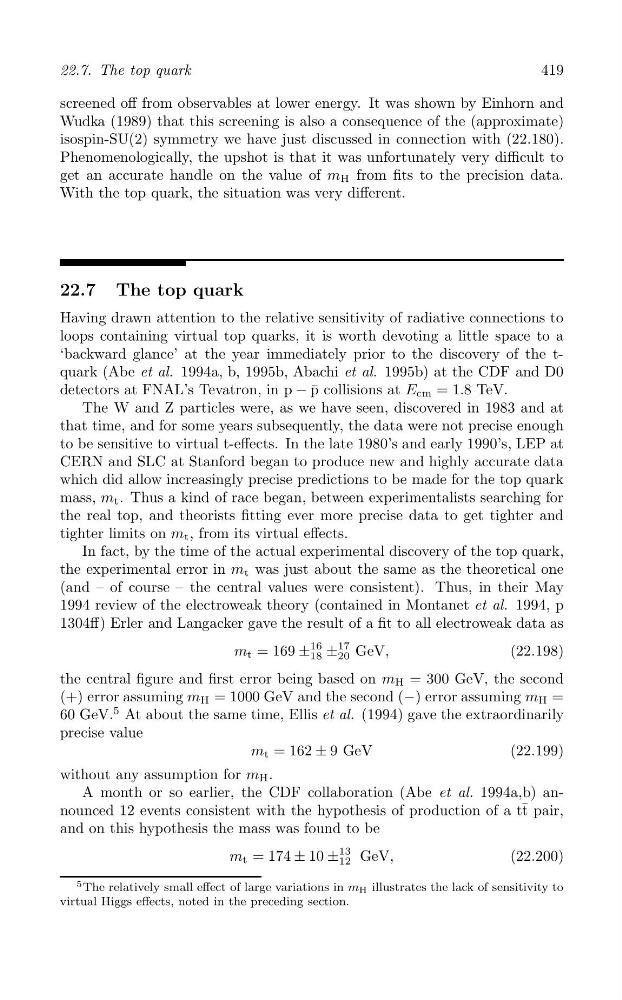
419
22.7. The top quark
screened off from observables at lower energy. It was shown by Einhorn and
Wudka (1989) that this screening is also a consequence of the (approximate)
isospin-SU(2) symmetry we have just discussed in connection with (22.180).
Phenomenologically, the upshot is that it was unfortunately very difficult to
get an accurate handle on the value of m H from fits to the precision data.
With the top quark, the situation was very different.
22.7 The top quark
Having drawn attention to the relative sensitivity of radiative connections to
loops containing virtual top quarks, it is worth devoting a little space to a
‘backward glance’ at the year immediately prior to the discovery of the tquark (Abe et al. 1994a, b, 1995b, Abachi et al. 1995b) at the CDF and D0
detectors at FNAL’s Tevatron, in p − ¯
= 1.8 TeV.
p collisions at E cm
The W and Z particles were, as we have seen, discovered in 1983 and at
that time, and for some years subsequently, the data were not precise enough
to be sensitive to virtual t-effects. In the late 1980’s and early 1990’s, LEP at
CERN and SLC at Stanford began to produce new and highly accurate data
which did allow increasingly precise predictions to be made for the top quark
mass, m t . Thus a kind of race began, between experimentalists searching for
the real top, and theorists fitting ever more precise data to get tighter and
tighter limits on m t , from its virtual effects.
In fact, by the time of the actual experimental discovery of the top quark,
the experimental error in m t was just about the same as the theoretical one
(and – of course – the central values were consistent). Thus, in their May
1994 review of the electroweak theory (contained in Montanet et al. 1994, p
1304ff) Erler and Langacker gave the result of a fit to all electroweak data as
18 ±
17
m t = 169 ±
16
20 GeV,
(22.198)
the central figure and first error being based on m H = 300 GeV, the second
(+) error assuming m H = 1000 GeV and the second (−) error assuming m H =
60 GeV.
5 At about the same time, Ellis et al. (1994) gave the extraordinarily
precise value
m t = 162 ± 9 GeV
(22.199)
without any assumption for m H .
A month or so earlier, the CDF collaboration (Abe et al. 1994a,b) announced 12 events consistent with the hypothesis of production of a t ¯ t pair,
and on this hypothesis the mass was found to be
m t = 174 ± 10 ±
13 GeV,
(22.200)
12
5 The relatively small effect of large variations in m H illustrates the lack of sensitivity to
virtual Higgs effects, noted in the preceding section.
22.7. The top quark
screened off from observables at lower energy. It was shown by Einhorn and
Wudka (1989) that this screening is also a consequence of the (approximate)
isospin-SU(2) symmetry we have just discussed in connection with (22.180).
Phenomenologically, the upshot is that it was unfortunately very difficult to
get an accurate handle on the value of m H from fits to the precision data.
With the top quark, the situation was very different.
22.7 The top quark
Having drawn attention to the relative sensitivity of radiative connections to
loops containing virtual top quarks, it is worth devoting a little space to a
‘backward glance’ at the year immediately prior to the discovery of the tquark (Abe et al. 1994a, b, 1995b, Abachi et al. 1995b) at the CDF and D0
detectors at FNAL’s Tevatron, in p − ¯
= 1.8 TeV.
p collisions at E cm
The W and Z particles were, as we have seen, discovered in 1983 and at
that time, and for some years subsequently, the data were not precise enough
to be sensitive to virtual t-effects. In the late 1980’s and early 1990’s, LEP at
CERN and SLC at Stanford began to produce new and highly accurate data
which did allow increasingly precise predictions to be made for the top quark
mass, m t . Thus a kind of race began, between experimentalists searching for
the real top, and theorists fitting ever more precise data to get tighter and
tighter limits on m t , from its virtual effects.
In fact, by the time of the actual experimental discovery of the top quark,
the experimental error in m t was just about the same as the theoretical one
(and – of course – the central values were consistent). Thus, in their May
1994 review of the electroweak theory (contained in Montanet et al. 1994, p
1304ff) Erler and Langacker gave the result of a fit to all electroweak data as
18 ±
17
m t = 169 ±
16
20 GeV,
(22.198)
the central figure and first error being based on m H = 300 GeV, the second
(+) error assuming m H = 1000 GeV and the second (−) error assuming m H =
60 GeV.
5 At about the same time, Ellis et al. (1994) gave the extraordinarily
precise value
m t = 162 ± 9 GeV
(22.199)
without any assumption for m H .
A month or so earlier, the CDF collaboration (Abe et al. 1994a,b) announced 12 events consistent with the hypothesis of production of a t ¯ t pair,
and on this hypothesis the mass was found to be
m t = 174 ± 10 ±
13 GeV,
(22.200)
12
5 The relatively small effect of large variations in m H illustrates the lack of sensitivity to
virtual Higgs effects, noted in the preceding section.