

393
22.4. The discovery of the W
± and Z
0 at the CERN p¯ p collider
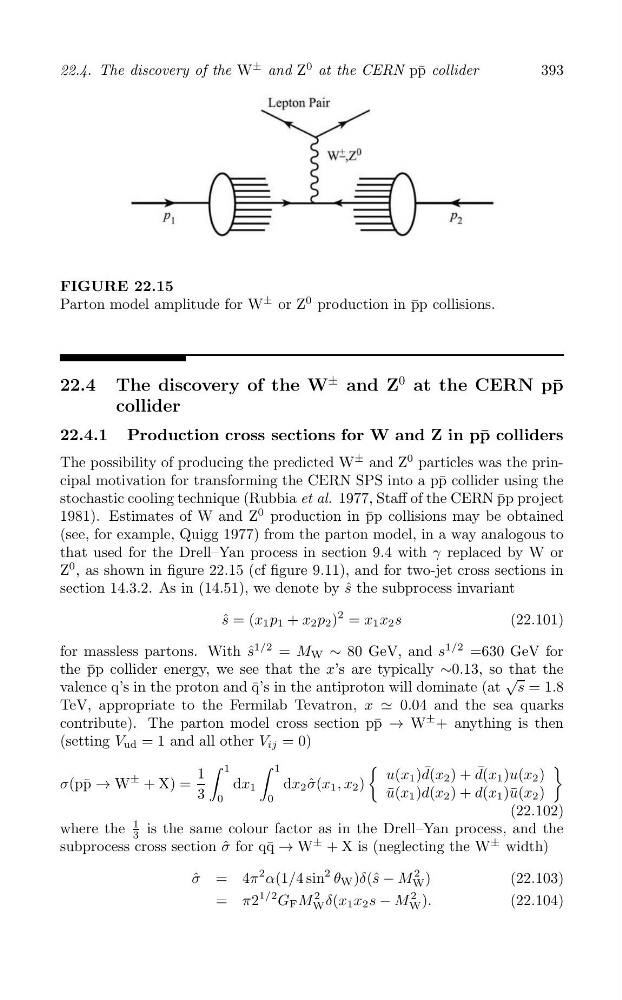
FIGURE 22.15
Parton model amplitude for W
± or Z
0 production in ¯
pp collisions.
22.4 The discovery of the W
± and Z
0 at the CERN p¯ p
collider
22.4.1 Production cross sections for W and Z in p¯ p colliders
The possibility of producing the predicted W
± and Z
0 particles was the principal motivation for transforming the CERN SPS into a p¯ p collider using the
stochastic cooling technique (Rubbia et al. 1977, Staff of the CERN ¯
pp project
1981). Estimates of W and Z
0 production in ¯
pp collisions may be obtained
(see, for example, Quigg 1977) from the parton model, in a way analogous to
that used for the Drell–Yan process in section 9.4 with γ replaced by W or
Z
0 , as shown in figure 22.15 (cf figure 9.11), and for two-jet cross sections in
section 14.3.2. As in (14.51), we denote by ˆ
s the subprocess invariant
s ˆ = (x 1 p 1 + x 2 p 2 )
2 = x 1 x 2 s
(22.101)
1/2
1/2
for massless partons. With ˆ
s
= M W ∼ 80 GeV, and s
=630 GeV for
the ¯
pp collider energy, we see that the x’s are typically ∼0.13, so that the
√
valence q’s in the proton and ¯
s = 1.8
q’s in the antiproton will dominate (at
TeV, appropriate to the Fermilab Tevatron, x ⋍ 0.04 and the sea quarks
contribute). The parton model cross section p¯ p → W
± + anything is then
(setting V ud = 1 and all other V ij = 0)
∫
∫
(
)
1
1
¯
1
u(x 1 )d(x 2 ) + d ¯ (x 1 )u(x 2 )
σ(p¯ p → W
± + X) =
dx 1
dx 2 σ ˆ(x 1 , x 2 )
3
u ¯(x 1 )d(x 2 ) + d(x 1 )¯ u(x 2 )
0
0
(22.102)
where the
1 is the same colour factor as in the Drell–Yan process, and the
3
subprocess cross section ˆ
σ for q¯ q → W
± + X is (neglecting the W
± width)
σ ˆ = 4π
2 α(1/4 sin
2 θ W )δ(ˆ s − M
2
(22.103)
=
W δ(x 1 x 2 s − M
2
(22.104)
W )
π2
1/2 G F M
2
W ).
22.4. The discovery of the W
± and Z
0 at the CERN p¯ p collider
FIGURE 22.15
Parton model amplitude for W
± or Z
0 production in ¯
pp collisions.
22.4 The discovery of the W
± and Z
0 at the CERN p¯ p
collider
22.4.1 Production cross sections for W and Z in p¯ p colliders
The possibility of producing the predicted W
± and Z
0 particles was the principal motivation for transforming the CERN SPS into a p¯ p collider using the
stochastic cooling technique (Rubbia et al. 1977, Staff of the CERN ¯
pp project
1981). Estimates of W and Z
0 production in ¯
pp collisions may be obtained
(see, for example, Quigg 1977) from the parton model, in a way analogous to
that used for the Drell–Yan process in section 9.4 with γ replaced by W or
Z
0 , as shown in figure 22.15 (cf figure 9.11), and for two-jet cross sections in
section 14.3.2. As in (14.51), we denote by ˆ
s the subprocess invariant
s ˆ = (x 1 p 1 + x 2 p 2 )
2 = x 1 x 2 s
(22.101)
1/2
1/2
for massless partons. With ˆ
s
= M W ∼ 80 GeV, and s
=630 GeV for
the ¯
pp collider energy, we see that the x’s are typically ∼0.13, so that the
√
valence q’s in the proton and ¯
s = 1.8
q’s in the antiproton will dominate (at
TeV, appropriate to the Fermilab Tevatron, x ⋍ 0.04 and the sea quarks
contribute). The parton model cross section p¯ p → W
± + anything is then
(setting V ud = 1 and all other V ij = 0)
∫
∫
(
)
1
1
¯
1
u(x 1 )d(x 2 ) + d ¯ (x 1 )u(x 2 )
σ(p¯ p → W
± + X) =
dx 1
dx 2 σ ˆ(x 1 , x 2 )
3
u ¯(x 1 )d(x 2 ) + d(x 1 )¯ u(x 2 )
0
0
(22.102)
where the
1 is the same colour factor as in the Drell–Yan process, and the
3
subprocess cross section ˆ
σ for q¯ q → W
± + X is (neglecting the W
± width)
σ ˆ = 4π
2 α(1/4 sin
2 θ W )δ(ˆ s − M
2
(22.103)
=
W δ(x 1 x 2 s − M
2
(22.104)
W )
π2
1/2 G F M
2
W ).