

361
21.4. Neutrino mixing and oscillations
1
0.8
0.6
0.4
0.2
0
L 0 /E ν (km/MeV)
e
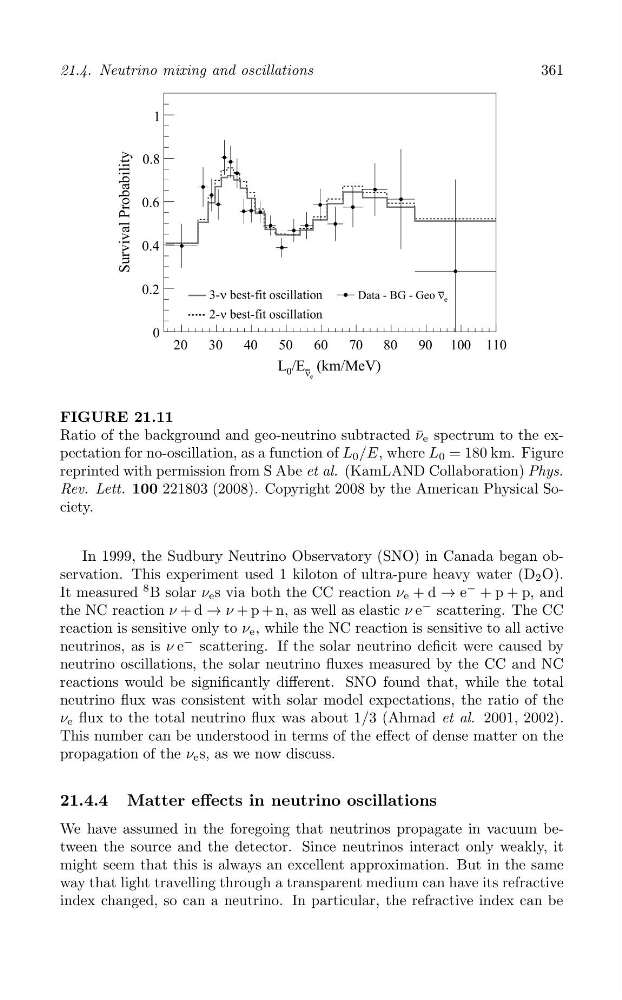
FIGURE 21.11
Ratio of the background and geo-neutrino subtracted ¯
ν e spectrum to the expectation for no-oscillation, as a function of L 0 /E, where L 0 = 180 km. Figure
reprinted with permission from S Abe et al. (KamLAND Collaboration) Phys.
Rev. Lett. 100 221803 (2008). Copyright 2008 by the American Physical Society.
In 1999, the Sudbury Neutrino Observatory (SNO) in Canada began observation. This experiment used 1 kiloton of ultra-pure heavy water (D 2 O).
It measured
8 B solar ν e s via both the CC reaction ν e + d → e
− + p + p, and
the NC reaction ν + d → ν + p + n, as well as elastic ν e
− scattering. The CC
reaction is sensitive only to ν e , while the NC reaction is sensitive to all active
neutrinos, as is ν e
− scattering. If the solar neutrino deficit were caused by
neutrino oscillations, the solar neutrino fluxes measured by the CC and NC
reactions would be significantly different. SNO found that, while the total
neutrino flux was consistent with solar model expectations, the ratio of the
ν e flux to the total neutrino flux was about 1/3 (Ahmad et al. 2001, 2002).
This number can be understood in terms of the effect of dense matter on the
propagation of the ν e s, as we now discuss.
21.4.4 Matter effects in neutrino oscillations
We have assumed in the foregoing that neutrinos propagate in vacuum between the source and the detector. Since neutrinos interact only weakly, it
might seem that this is always an excellent approximation. But in the same
way that light travelling through a transparent medium can have its refractive
index changed, so can a neutrino. In particular, the refractive index can be
Survival Probability
e
ν
Data - BG - Geo
best-fit oscillation
ν
3best-fit oscillation
ν
220
30
40
50
60
70 80
90 100 110
21.4. Neutrino mixing and oscillations
1
0.8
0.6
0.4
0.2
0
L 0 /E ν (km/MeV)
e
FIGURE 21.11
Ratio of the background and geo-neutrino subtracted ¯
ν e spectrum to the expectation for no-oscillation, as a function of L 0 /E, where L 0 = 180 km. Figure
reprinted with permission from S Abe et al. (KamLAND Collaboration) Phys.
Rev. Lett. 100 221803 (2008). Copyright 2008 by the American Physical Society.
In 1999, the Sudbury Neutrino Observatory (SNO) in Canada began observation. This experiment used 1 kiloton of ultra-pure heavy water (D 2 O).
It measured
8 B solar ν e s via both the CC reaction ν e + d → e
− + p + p, and
the NC reaction ν + d → ν + p + n, as well as elastic ν e
− scattering. The CC
reaction is sensitive only to ν e , while the NC reaction is sensitive to all active
neutrinos, as is ν e
− scattering. If the solar neutrino deficit were caused by
neutrino oscillations, the solar neutrino fluxes measured by the CC and NC
reactions would be significantly different. SNO found that, while the total
neutrino flux was consistent with solar model expectations, the ratio of the
ν e flux to the total neutrino flux was about 1/3 (Ahmad et al. 2001, 2002).
This number can be understood in terms of the effect of dense matter on the
propagation of the ν e s, as we now discuss.
21.4.4 Matter effects in neutrino oscillations
We have assumed in the foregoing that neutrinos propagate in vacuum between the source and the detector. Since neutrinos interact only weakly, it
might seem that this is always an excellent approximation. But in the same
way that light travelling through a transparent medium can have its refractive
index changed, so can a neutrino. In particular, the refractive index can be
Survival Probability
e
ν
Data - BG - Geo
best-fit oscillation
ν
3best-fit oscillation
ν
220
30
40
50
60
70 80
90 100 110