

341
21.2. CP violation in B meson oscillations
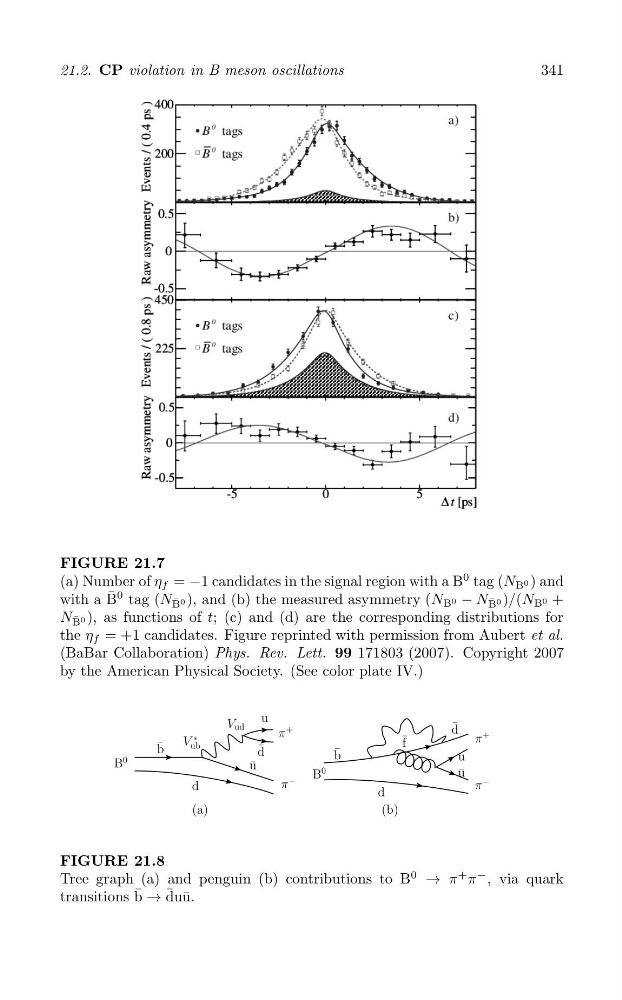
FIGURE 21.7
(a) Number of η f = −1 candidates in the signal region with a B
0 tag (N B 0 ) and
with a B ¯ 0 tag (N B ¯ 0 ), and (b) the measured asymmetry (N B 0 − N B ¯ 0 )/(N B 0 +
N B ¯ 0 ), as functions of t; (c) and (d) are the corresponding distributions for
the η f = +1 candidates. Figure reprinted with permission from Aubert et al.
(BaBar Collaboration) Phys. Rev. Lett. 99 171803 (2007). Copyright 2007
by the American Physical Society. (See color plate IV.)
π
+
π
−
V ud
V
∗
ub
B
0
u
¯
d
¯
u
¯
b
d
(a)
¯ f
¯
d
π
+
u
¯
u
π
−
d
(b)
¯
b
B
0
FIGURE 21.8
Tree graph (a) and penguin (b) contributions to B
0
→ π
+ π
− , via quark
¯
transitions b ¯ → du¯ u.
21.2. CP violation in B meson oscillations
FIGURE 21.7
(a) Number of η f = −1 candidates in the signal region with a B
0 tag (N B 0 ) and
with a B ¯ 0 tag (N B ¯ 0 ), and (b) the measured asymmetry (N B 0 − N B ¯ 0 )/(N B 0 +
N B ¯ 0 ), as functions of t; (c) and (d) are the corresponding distributions for
the η f = +1 candidates. Figure reprinted with permission from Aubert et al.
(BaBar Collaboration) Phys. Rev. Lett. 99 171803 (2007). Copyright 2007
by the American Physical Society. (See color plate IV.)
π
+
π
−
V ud
V
∗
ub
B
0
u
¯
d
¯
u
¯
b
d
(a)
¯ f
¯
d
π
+
u
¯
u
π
−
d
(b)
¯
b
B
0
FIGURE 21.8
Tree graph (a) and penguin (b) contributions to B
0
→ π
+ π
− , via quark
¯
transitions b ¯ → du¯ u.