

330
21. CP Violation and Oscillation Phenomena
V us
¯ s
u
K
+
¯
u
π
−
d
¯
b
B
0
V
∗
ub
W
+
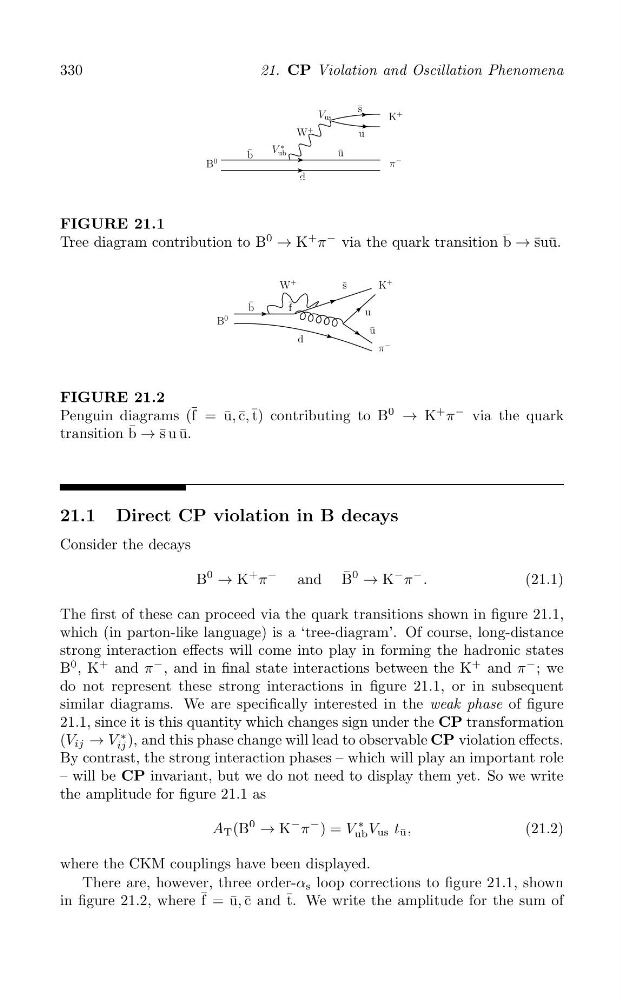
FIGURE 21.1
Tree diagram contribution to B
0
→ K
+ π
− via the quark transition ¯
b → ¯ su¯ u.
B
0
K
+
¯ f
¯ s
u
¯
u
π
−
d
¯
b
W
+
FIGURE 21.2
Penguin diagrams ( ¯ f = ¯
u, ¯ c, ¯ t) contributing to B
0
→ K
+ π
− via the quark
transition ¯
b
¯ s u ¯
u.
→
21.1 Direct CP violation in B decays
Consider the decays
B
0
→ K
+ π
−
¯
and B
0
→ K
− π
− .
(21.1)
The first of these can proceed via the quark transitions shown in figure 21.1,
which (in parton-like language) is a ‘tree-diagram’. Of course, long-distance
strong interaction effects will come into play in forming the hadronic states
B
0 , K
+ and π
− , and in final state interactions between the K
+ and π
− ; we
do not represent these strong interactions in figure 21.1, or in subsequent
similar diagrams. We are specifically interested in the weak phase of figure
21.1, since it is this quantity which changes sign under the CP transformation
(V ij → V ij
∗ ), and this phase change will lead to observable CP violation effects.
By contrast, the strong interaction phases – which will play an important role
– will be CP invariant, but we do not need to display them yet. So we write
the amplitude for figure 21.1 as
A T (B
0
→ K
− π
− ) = V ub
∗ V us t u ¯ ,
(21.2)
where the CKM couplings have been displayed.
There are, however, three order-α s loop corrections to figure 21.1, shown
¯
in figure 21.2, where f = u ¯, ¯ c and ¯ t. We write the amplitude for the sum of
21. CP Violation and Oscillation Phenomena
V us
¯ s
u
K
+
¯
u
π
−
d
¯
b
B
0
V
∗
ub
W
+
FIGURE 21.1
Tree diagram contribution to B
0
→ K
+ π
− via the quark transition ¯
b → ¯ su¯ u.
B
0
K
+
¯ f
¯ s
u
¯
u
π
−
d
¯
b
W
+
FIGURE 21.2
Penguin diagrams ( ¯ f = ¯
u, ¯ c, ¯ t) contributing to B
0
→ K
+ π
− via the quark
transition ¯
b
¯ s u ¯
u.
→
21.1 Direct CP violation in B decays
Consider the decays
B
0
→ K
+ π
−
¯
and B
0
→ K
− π
− .
(21.1)
The first of these can proceed via the quark transitions shown in figure 21.1,
which (in parton-like language) is a ‘tree-diagram’. Of course, long-distance
strong interaction effects will come into play in forming the hadronic states
B
0 , K
+ and π
− , and in final state interactions between the K
+ and π
− ; we
do not represent these strong interactions in figure 21.1, or in subsequent
similar diagrams. We are specifically interested in the weak phase of figure
21.1, since it is this quantity which changes sign under the CP transformation
(V ij → V ij
∗ ), and this phase change will lead to observable CP violation effects.
By contrast, the strong interaction phases – which will play an important role
– will be CP invariant, but we do not need to display them yet. So we write
the amplitude for figure 21.1 as
A T (B
0
→ K
− π
− ) = V ub
∗ V us t u ¯ ,
(21.2)
where the CKM couplings have been displayed.
There are, however, three order-α s loop corrections to figure 21.1, shown
¯
in figure 21.2, where f = u ¯, ¯ c and ¯ t. We write the amplitude for the sum of