

315
20.7. Quark weak currents
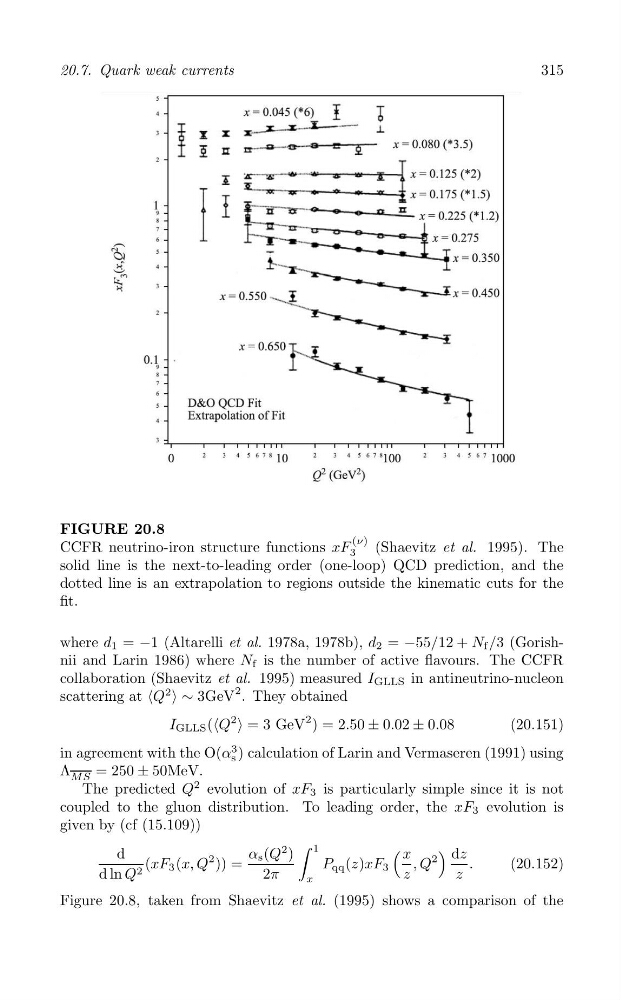
FIGURE 20.8
(ν)
CCFR neutrino-iron structure functions xF
(Shaevitz et al. 1995). The
3
solid line is the next-to-leading order (one-loop) QCD prediction, and the
dotted line is an extrapolation to regions outside the kinematic cuts for the
fit.
where d 1 = −1 (Altarelli et al. 1978a, 1978b), d 2 = −55/12 + N f /3 (Gorishnii and Larin 1986) where N f is the number of active flavours. The CCFR
collaboration (Shaevitz et al. 1995) measured I GLLS in antineutrino-nucleon
scattering at ‹Q
2
› ∼ 3GeV
2 . They obtained
I GLLS (‹Q
2
› = 3 GeV
2 ) = 2.50 ± 0.02 ± 0.08
(20.151)
in agreement with the O(α
3 ) calculation of Larin and Vermaseren (1991) using
s
Λ
= 250 ± 50MeV.
MS
The predicted Q
2 evolution of xF 3 is particularly simple since it is not
coupled to the gluon distribution. To leading order, the xF 3 evolution is
given by (cf (15.109))
∫ 1
(
)
d
α s (Q
2 )
x
dz
(xF 3 (x, Q
2 )) =
P qq (z)xF 3
, Q
2
.
(20.152)
d ln Q 2
2π
z
z
x
Figure 20.8, taken from Shaevitz et al. (1995) shows a comparison of the
20.7. Quark weak currents
FIGURE 20.8
(ν)
CCFR neutrino-iron structure functions xF
(Shaevitz et al. 1995). The
3
solid line is the next-to-leading order (one-loop) QCD prediction, and the
dotted line is an extrapolation to regions outside the kinematic cuts for the
fit.
where d 1 = −1 (Altarelli et al. 1978a, 1978b), d 2 = −55/12 + N f /3 (Gorishnii and Larin 1986) where N f is the number of active flavours. The CCFR
collaboration (Shaevitz et al. 1995) measured I GLLS in antineutrino-nucleon
scattering at ‹Q
2
› ∼ 3GeV
2 . They obtained
I GLLS (‹Q
2
› = 3 GeV
2 ) = 2.50 ± 0.02 ± 0.08
(20.151)
in agreement with the O(α
3 ) calculation of Larin and Vermaseren (1991) using
s
Λ
= 250 ± 50MeV.
MS
The predicted Q
2 evolution of xF 3 is particularly simple since it is not
coupled to the gluon distribution. To leading order, the xF 3 evolution is
given by (cf (15.109))
∫ 1
(
)
d
α s (Q
2 )
x
dz
(xF 3 (x, Q
2 )) =
P qq (z)xF 3
, Q
2
.
(20.152)
d ln Q 2
2π
z
z
x
Figure 20.8, taken from Shaevitz et al. (1995) shows a comparison of the