

313
20.7. Quark weak currents
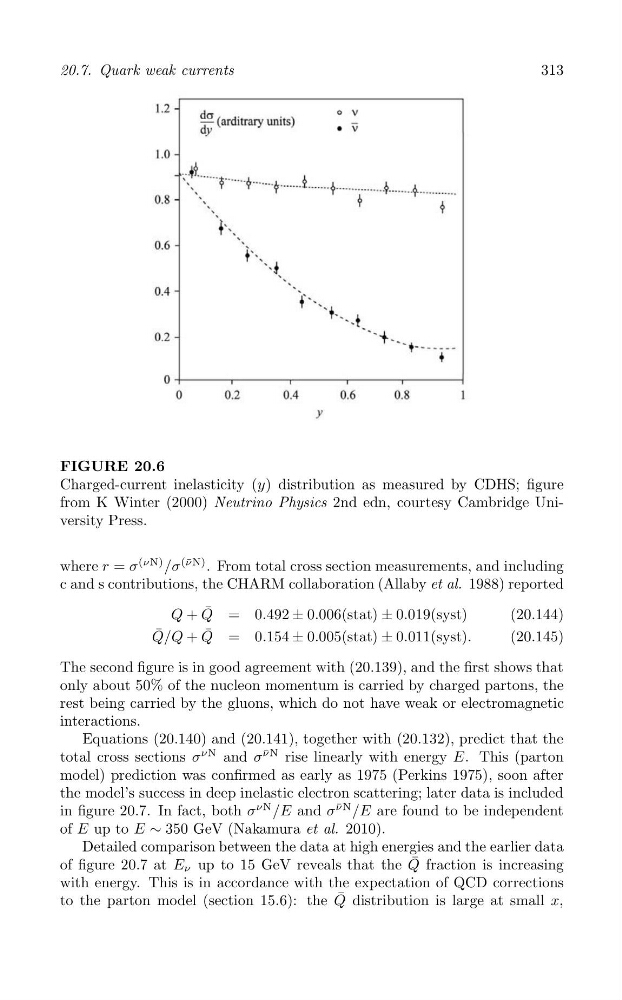
FIGURE 20.6
Charged-current inelasticity (y) distribution as measured by CDHS; figure
from K Winter (2000) Neutrino Physics 2nd edn, courtesy Cambridge University Press.
where r = σ
(νN) /σ
(¯ νN) . From total cross section measurements, and including
c and s contributions, the CHARM collaboration (Allaby et al. 1988) reported
Q + Q ¯ = 0.492 ± 0.006(stat) ± 0.019(syst)
(20.144)
¯
Q/Q + Q ¯ = 0.154 ± 0.005(stat) ± 0.011(syst).
(20.145)
The second figure is in good agreement with (20.139), and the first shows that
only about 50% of the nucleon momentum is carried by charged partons, the
rest being carried by the gluons, which do not have weak or electromagnetic
interactions.
Equations (20.140) and (20.141), together with (20.132), predict that the
νN
total cross sections σ
νN and σ
¯
rise linearly with energy E. This (parton
model) prediction was confirmed as early as 1975 (Perkins 1975), soon after
the model’s success in deep inelastic electron scattering; later data is included
in figure 20.7. In fact, both σ
νN /E and σ
ν ¯N /E are found to be independent
of E up to E ∼ 350 GeV (Nakamura et al. 2010).
Detailed comparison between the data at high energies and the earlier data
of figure 20.7 at E ν up to 15 GeV reveals that the Q ¯ fraction is increasing
with energy. This is in accordance with the expectation of QCD corrections
¯
to the parton model (section 15.6): the Q distribution is large at small x,
20.7. Quark weak currents
FIGURE 20.6
Charged-current inelasticity (y) distribution as measured by CDHS; figure
from K Winter (2000) Neutrino Physics 2nd edn, courtesy Cambridge University Press.
where r = σ
(νN) /σ
(¯ νN) . From total cross section measurements, and including
c and s contributions, the CHARM collaboration (Allaby et al. 1988) reported
Q + Q ¯ = 0.492 ± 0.006(stat) ± 0.019(syst)
(20.144)
¯
Q/Q + Q ¯ = 0.154 ± 0.005(stat) ± 0.011(syst).
(20.145)
The second figure is in good agreement with (20.139), and the first shows that
only about 50% of the nucleon momentum is carried by charged partons, the
rest being carried by the gluons, which do not have weak or electromagnetic
interactions.
Equations (20.140) and (20.141), together with (20.132), predict that the
νN
total cross sections σ
νN and σ
¯
rise linearly with energy E. This (parton
model) prediction was confirmed as early as 1975 (Perkins 1975), soon after
the model’s success in deep inelastic electron scattering; later data is included
in figure 20.7. In fact, both σ
νN /E and σ
ν ¯N /E are found to be independent
of E up to E ∼ 350 GeV (Nakamura et al. 2010).
Detailed comparison between the data at high energies and the earlier data
of figure 20.7 at E ν up to 15 GeV reveals that the Q ¯ fraction is increasing
with energy. This is in accordance with the expectation of QCD corrections
¯
to the parton model (section 15.6): the Q distribution is large at small x,