

77
14.1. The colour degree of freedom
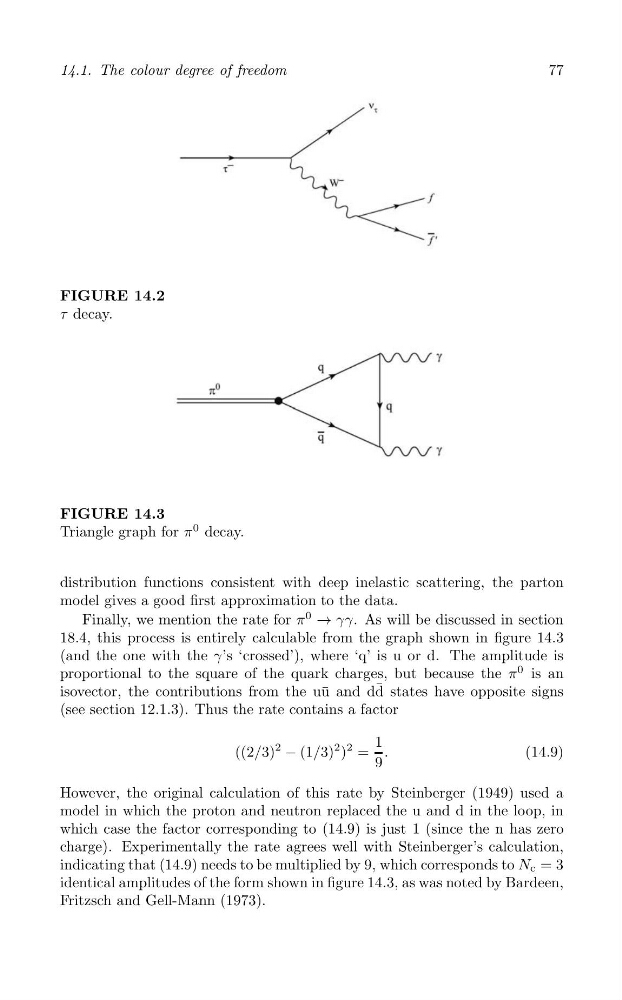
FIGURE 14.2
τ decay.
FIGURE 14.3
Triangle graph for π
0 decay.
distribution functions consistent with deep inelastic scattering, the parton
model gives a good first approximation to the data.
Finally, we mention the rate for π
0
→ γγ. As will be discussed in section
18.4, this process is entirely calculable from the graph shown in figure 14.3
(and the one with the γ’s ‘crossed’), where ‘q’ is u or d. The amplitude is
proportional to the square of the quark charges, but because the π
0 is an
isovector, the contributions from the u¯ u and d ¯
d states have opposite signs
(see section 12.1.3). Thus the rate contains a factor
((2/3)
2
− (1/3)
2 )
2 =
1 .
(14.9)
9
However, the original calculation of this rate by Steinberger (1949) used a
model in which the proton and neutron replaced the u and d in the loop, in
which case the factor corresponding to (14.9) is just 1 (since the n has zero
charge). Experimentally the rate agrees well with Steinberger’s calculation,
indicating that (14.9) needs to be multiplied by 9, which corresponds to N c = 3
identical amplitudes of the form shown in figure 14.3, as was noted by Bardeen,
Fritzsch and Gell-Mann (1973).
14.1. The colour degree of freedom
FIGURE 14.2
τ decay.
FIGURE 14.3
Triangle graph for π
0 decay.
distribution functions consistent with deep inelastic scattering, the parton
model gives a good first approximation to the data.
Finally, we mention the rate for π
0
→ γγ. As will be discussed in section
18.4, this process is entirely calculable from the graph shown in figure 14.3
(and the one with the γ’s ‘crossed’), where ‘q’ is u or d. The amplitude is
proportional to the square of the quark charges, but because the π
0 is an
isovector, the contributions from the u¯ u and d ¯
d states have opposite signs
(see section 12.1.3). Thus the rate contains a factor
((2/3)
2
− (1/3)
2 )
2 =
1 .
(14.9)
9
However, the original calculation of this rate by Steinberger (1949) used a
model in which the proton and neutron replaced the u and d in the loop, in
which case the factor corresponding to (14.9) is just 1 (since the n has zero
charge). Experimentally the rate agrees well with Steinberger’s calculation,
indicating that (14.9) needs to be multiplied by 9, which corresponds to N c = 3
identical amplitudes of the form shown in figure 14.3, as was noted by Bardeen,
Fritzsch and Gell-Mann (1973).