

76
14. QCD I: Introduction, Tree Graph Predictions, and Jets
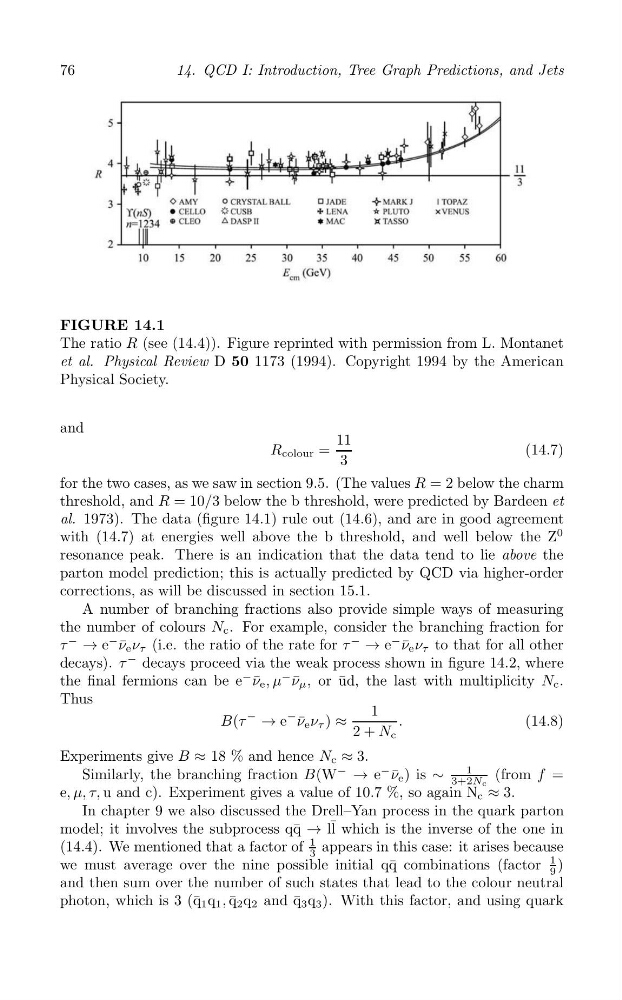
FIGURE 14.1
The ratio R (see (14.4)). Figure reprinted with permission from L. Montanet
et al. Physical Review D 50 1173 (1994). Copyright 1994 by the American
Physical Society.
and
11
R colour =
(14.7)
3
for the two cases, as we saw in section 9.5. (The values R = 2 below the charm
threshold, and R = 10/3 below the b threshold, were predicted by Bardeen et
al. 1973). The data (figure 14.1) rule out (14.6), and are in good agreement
with (14.7) at energies well above the b threshold, and well below the Z
0
resonance peak. There is an indication that the data tend to lie above the
parton model prediction; this is actually predicted by QCD via higher-order
corrections, as will be discussed in section 15.1.
A number of branching fractions also provide simple ways of measuring
the number of colours N c . For example, consider the branching fraction for
τ
−
→ e
− ν ¯ e ν τ (i.e. the ratio of the rate for τ
−
→ e
− ν ¯ e ν τ to that for all other
decays). τ
− decays proceed via the weak process shown in figure 14.2, where
the final fermions can be e
− ν ¯ e , μ
− ν ¯ μ , or ¯
ud, the last with multiplicity N c .
Thus
B(τ
−
→
− ¯
1
e ν e ν τ ) ≈
.
(14.8)
2 + N c
Experiments give B ≈ 18 % and hence N c ≈ 3.
1
Similarly, the branching fraction B(W
−
→ e
− ν ¯ ) is ∼
(from f =
e
3+2Nc
e, μ, τ, u and c). Experiment gives a value of 10.7 %, so again N c ≈ 3.
In chapter 9 we also discussed the Drell–Yan process in the quark parton
model; it involves the subprocess q¯ q → l ¯ l which is the inverse of the one in
(14.4). We mentioned that a factor of
1 appears in this case: it arises because
3
we must average over the nine possible initial q¯ q combinations (factor
1 )
and then sum over the number of such states that lead to the colour neutral
photon, which is 3 (¯ q 1 q 1 , q ¯ 2 q 2 and ¯
q 3 q 3 ). With this factor, and using quark
9
14. QCD I: Introduction, Tree Graph Predictions, and Jets
FIGURE 14.1
The ratio R (see (14.4)). Figure reprinted with permission from L. Montanet
et al. Physical Review D 50 1173 (1994). Copyright 1994 by the American
Physical Society.
and
11
R colour =
(14.7)
3
for the two cases, as we saw in section 9.5. (The values R = 2 below the charm
threshold, and R = 10/3 below the b threshold, were predicted by Bardeen et
al. 1973). The data (figure 14.1) rule out (14.6), and are in good agreement
with (14.7) at energies well above the b threshold, and well below the Z
0
resonance peak. There is an indication that the data tend to lie above the
parton model prediction; this is actually predicted by QCD via higher-order
corrections, as will be discussed in section 15.1.
A number of branching fractions also provide simple ways of measuring
the number of colours N c . For example, consider the branching fraction for
τ
−
→ e
− ν ¯ e ν τ (i.e. the ratio of the rate for τ
−
→ e
− ν ¯ e ν τ to that for all other
decays). τ
− decays proceed via the weak process shown in figure 14.2, where
the final fermions can be e
− ν ¯ e , μ
− ν ¯ μ , or ¯
ud, the last with multiplicity N c .
Thus
B(τ
−
→
− ¯
1
e ν e ν τ ) ≈
.
(14.8)
2 + N c
Experiments give B ≈ 18 % and hence N c ≈ 3.
1
Similarly, the branching fraction B(W
−
→ e
− ν ¯ ) is ∼
(from f =
e
3+2Nc
e, μ, τ, u and c). Experiment gives a value of 10.7 %, so again N c ≈ 3.
In chapter 9 we also discussed the Drell–Yan process in the quark parton
model; it involves the subprocess q¯ q → l ¯ l which is the inverse of the one in
(14.4). We mentioned that a factor of
1 appears in this case: it arises because
3
we must average over the nine possible initial q¯ q combinations (factor
1 )
and then sum over the number of such states that lead to the colour neutral
photon, which is 3 (¯ q 1 q 1 , q ¯ 2 q 2 and ¯
q 3 q 3 ). With this factor, and using quark
9