

283
0.8
1
1.2
9.3. Partons as quarks and gluons
1.2
x f(x)
x f(x)
1
0.8
0.6
0.6
0.4
0.4
0.2
0.2
0
0
-4
-3
-2
-1
-4
-3
-2
-1
10
10
10
10
10
10
10
10
x
x
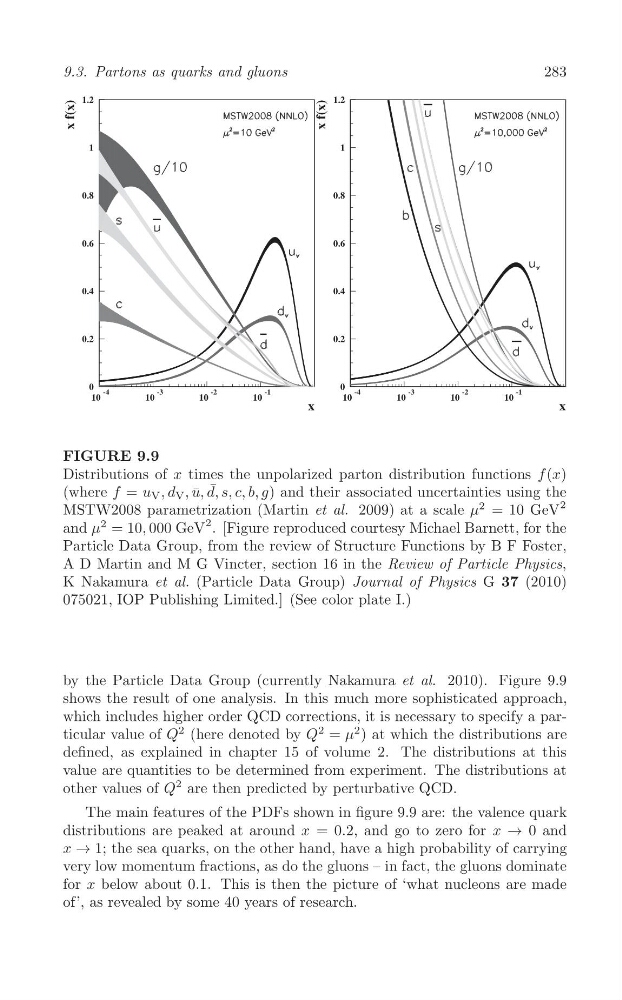
FIGURE 9.9
Distributions of x times the unpolarized parton distribution functions f (x)
¯
(where f = u V , d V , ¯ d, s, c, b, g) and their associated uncertainties using the
u,
MSTW2008 parametrization (Martin et al. 2009) at a scale μ
2 = 10 GeV
2
and μ
2 = 10, 000 GeV
2 . [Figure reproduced courtesy Michael Barnett, for the
Particle Data Group, from the review of Structure Functions by B F Foster,
A D Martin and M G Vincter, section 16 in the Review of Particle Physics,
K Nakamura et al. (Particle Data Group) Journal of Physics G 37 (2010)
075021, IOP Publishing Limited.] (See color plate I.)
by the Particle Data Group (currently Nakamura et al. 2010). Figure 9.9
shows the result of one analysis. In this much more sophisticated approach,
which includes higher order QCD corrections, it is necessary to specify a particular value of Q
2 (here denoted by Q
2 = μ
2 ) at which the distributions are
defined, as explained in chapter 15 of volume 2. The distributions at this
value are quantities to be determined from experiment. The distributions at
other values of Q
2 are then predicted by perturbative QCD.
The main features of the PDFs shown in figure 9.9 are: the valence quark
distributions are peaked at around x = 0.2, and go to zero for x → 0 and
x → 1; the sea quarks, on the other hand, have a high probability of carrying
very low momentum fractions, as do the gluons – in fact, the gluons dominate
for x below about 0.1. This is then the picture of ‘what nucleons are made
of’, as revealed by some 40 years of research.
0.8
1
1.2
9.3. Partons as quarks and gluons
1.2
x f(x)
x f(x)
1
0.8
0.6
0.6
0.4
0.4
0.2
0.2
0
0
-4
-3
-2
-1
-4
-3
-2
-1
10
10
10
10
10
10
10
10
x
x
FIGURE 9.9
Distributions of x times the unpolarized parton distribution functions f (x)
¯
(where f = u V , d V , ¯ d, s, c, b, g) and their associated uncertainties using the
u,
MSTW2008 parametrization (Martin et al. 2009) at a scale μ
2 = 10 GeV
2
and μ
2 = 10, 000 GeV
2 . [Figure reproduced courtesy Michael Barnett, for the
Particle Data Group, from the review of Structure Functions by B F Foster,
A D Martin and M G Vincter, section 16 in the Review of Particle Physics,
K Nakamura et al. (Particle Data Group) Journal of Physics G 37 (2010)
075021, IOP Publishing Limited.] (See color plate I.)
by the Particle Data Group (currently Nakamura et al. 2010). Figure 9.9
shows the result of one analysis. In this much more sophisticated approach,
which includes higher order QCD corrections, it is necessary to specify a particular value of Q
2 (here denoted by Q
2 = μ
2 ) at which the distributions are
defined, as explained in chapter 15 of volume 2. The distributions at this
value are quantities to be determined from experiment. The distributions at
other values of Q
2 are then predicted by perturbative QCD.
The main features of the PDFs shown in figure 9.9 are: the valence quark
distributions are peaked at around x = 0.2, and go to zero for x → 0 and
x → 1; the sea quarks, on the other hand, have a high probability of carrying
very low momentum fractions, as do the gluons – in fact, the gluons dominate
for x below about 0.1. This is then the picture of ‘what nucleons are made
of’, as revealed by some 40 years of research.