

140
as well as with chlorophyll (a) a, at a correlation coefficient of (r = 0.86, p<0.0001). Fig.12
illustrates well the seasonal variation of the two factors: temperature and dissolved oxygen, it
shows the inverse relationship between these two parameters during the seasons, the two curves
in opposite direction, oxygen decreases with increasing temperature, the opposite is true.
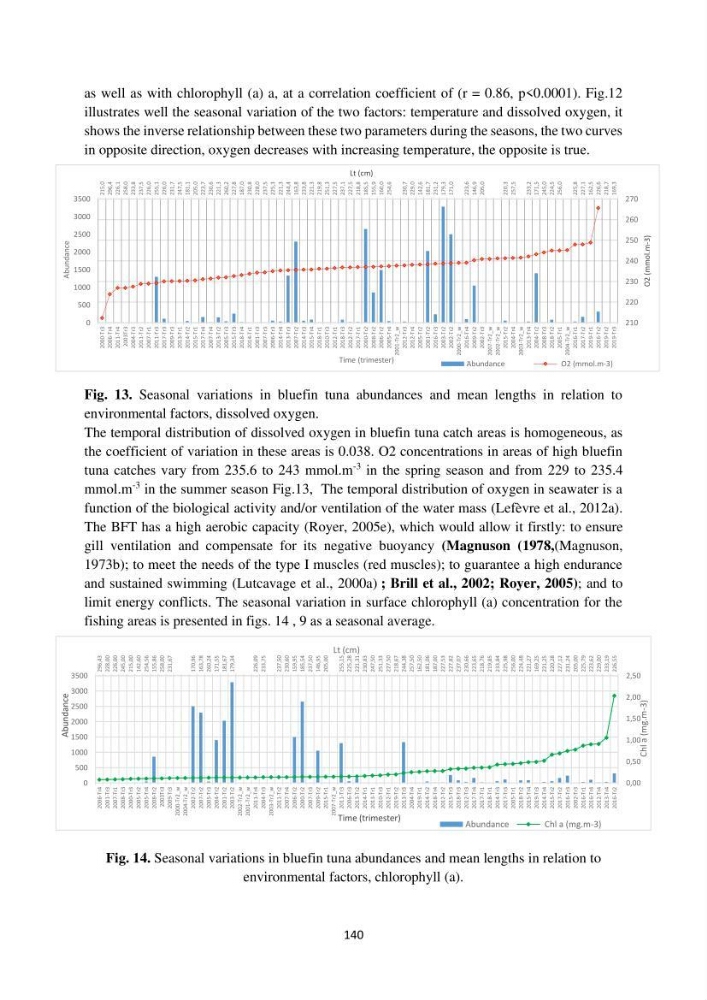
Fig. 13. Seasonal variations in bluefin tuna abundances and mean lengths in relation to
environmental factors, dissolved oxygen.
The temporal distribution of dissolved oxygen in bluefin tuna catch areas is homogeneous, as
the coefficient of variation in these areas is 0.038. O2 concentrations in areas of high bluefin
tuna catches vary from 235.6 to 243 mmol.m
-3 in the spring season and from 229 to 235.4
mmol.m
-3 in the summer season Fig.13, The temporal distribution of oxygen in seawater is a
function of the biological activity and/or ventilation of the water mass (Lefèvre et al., 2012a).
The BFT has a high aerobic capacity (Royer, 2005e), which would allow it firstly: to ensure
gill ventilation and compensate for its negative buoyancy (Magnuson (1978,(Magnuson,
1973b); to meet the needs of the type I muscles (red muscles); to guarantee a high endurance
and sustained swimming (Lutcavage et al., 2000a) ; Brill et al., 2002; Royer, 2005); and to
limit energy conflicts. The seasonal variation in surface chlorophyll (a) concentration for the
fishing areas is presented in figs. 14 , 9 as a seasonal average.
Fig. 14. Seasonal variations in bluefin tuna abundances and mean lengths in relation to
environmental factors, chlorophyll (a).
0
500
1000
1500
2000
2500
3000
3500
2000-Tr3 2006-Tr4
2011-Tr4 2003Tr3
2004-Tr3 2011-Tr2 2007-Tr1 2011-Tr3 2017-Tr3 2009-Tr3 2013-Tr1 2014-Tr2
2015-Tr1 2017-Tr4 2007-Tr4 2013-Tr2 2005-Tr3 2015-Tr3 2018-Tr4 2014-Tr1 2001-Tr3 2007-Tr3 2006-Tr3 2014-Tr4 2013-Tr3 2007-Tr2 2014-Tr3 2015-Tr4 2018-Tr1 2010-Tr3 2012-Tr1 2018-Tr3 2012-Tr2 2017-Tr1 2000-Tr2 2008-Tr2 2006-Tr2 2005-Tr4 2001-Tr2_w 2012-Tr3 2012-Tr4 2005-Tr2 2001-Tr2 2016-Tr3 2003-Tr2 2002-Tr2 2000-Tr2_w 2016-Tr4 2009-Tr2 2002-Tr3 2007-Tr2_w 2002-Tr2_w 2015-Tr2 2004-Tr4 2003-Tr2_w 2013-Tr4 2004-Tr2 2008-Tr3 2018-Tr2 2005-Tr1 2004-Tr2_w 2016-Tr1 2017-Tr2 2019-Tr1 2016-Tr2 2019-Tr2 2019-Tr3
210
220
230
240
250
260
270
215,0 296,4
226,1 258,0 233,8 237,5 226,0 255,1 226,0 231,7 247,5 181,1 205,0 223,7 230,6 221,3 260,2 227,8 187,0 230,8 228,0 237,5 225,3 221,3 244,4 163,8 233,8 221,3 219,8 251,3 227,5 237,1 227,5 218,8 185,5 155,9 160,0 254,6
230,7 229,0 142,6 181,7 231,2 179,3 171,0
223,6 146,9 205,0
220,3 257,5
233,2 171,5 245,0 224,5 256,0
225,8 227,1 162,5 226,6 218,7 169,3
Abundance
Time (trimester)
O2
(mmol.m-3)
Lt (cm)
Abundance
O2 (mmol.m-3)
0,00
0,50
1,00
1,50
2,00
2,50
296,43 228,00 226,00 245,00
215,00 142,60 254,56 155,86 258,00
231,67
170,96 163,78 260,24 171,55 181,67 179,34
226,09 233,75
237,50 230,60 159,95 185,54 237,50 146,95 205,00
255,15 225,28 221,31 230,83 247,50 251,33 227,50 218,67 244,38 257,50 162,50 181,06 187,00 227,53 227,82 237,07 230,66 223,65 218,76 219,85
233,84 225,98 256,00 224,48 221,27
169,25 221,25 220,28 227,12 231,24 205,00 225,79 223,62 229,00 233,19 226,55
0
500
1000
1500
2000
2500
3000
3500
2006-Tr4 2001-Tr3 2007-Tr1 2008-Tr3
2000-Tr3 2005-Tr2 2005-Tr4 2008-Tr2 2003Tr3
2009-Tr3 2000-Tr2_w 2004-Tr2_w
2002-Tr2 2007-Tr2 2005-Tr3 2004-Tr2 2001-Tr2 2003-Tr2 2002-Tr2_w 2001-Tr2_w
2011-Tr4 2004-Tr3 2003-Tr2_w
2011-Tr2 2007-Tr4 2006-Tr2 2000-Tr2 2007-Tr3 2009-Tr2 2015-Tr1
2007-Tr2_w
2011-Tr3 2006-Tr3 2013-Tr2 2014-Tr1 2013-Tr1 2010-Tr3 2012-Tr1 2019-Tr2 2013-Tr3 2004-Tr4 2019-Tr1 2014-Tr2 2018-Tr4 2012-Tr2 2015-Tr3 2018-Tr3 2012-Tr3 2017-Tr4 2017-Tr1 2018-Tr1
2014-Tr3 2017-Tr3 2005-Tr1 2018-Tr2 2015-Tr4
2019-Tr3 2014-Tr4 2015-Tr2 2017-Tr2 2016-Tr3 2002-Tr3 2016-Tr1 2016-Tr4 2012-Tr4 2013-Tr4 2016-Tr2
Chl
a
(mg.m-3)
Lt (cm)
Abundance
Time (trimester)
Abundance
Chl a (mg.m-3)
as well as with chlorophyll (a) a, at a correlation coefficient of (r = 0.86, p<0.0001). Fig.12
illustrates well the seasonal variation of the two factors: temperature and dissolved oxygen, it
shows the inverse relationship between these two parameters during the seasons, the two curves
in opposite direction, oxygen decreases with increasing temperature, the opposite is true.
Fig. 13. Seasonal variations in bluefin tuna abundances and mean lengths in relation to
environmental factors, dissolved oxygen.
The temporal distribution of dissolved oxygen in bluefin tuna catch areas is homogeneous, as
the coefficient of variation in these areas is 0.038. O2 concentrations in areas of high bluefin
tuna catches vary from 235.6 to 243 mmol.m
-3 in the spring season and from 229 to 235.4
mmol.m
-3 in the summer season Fig.13, The temporal distribution of oxygen in seawater is a
function of the biological activity and/or ventilation of the water mass (Lefèvre et al., 2012a).
The BFT has a high aerobic capacity (Royer, 2005e), which would allow it firstly: to ensure
gill ventilation and compensate for its negative buoyancy (Magnuson (1978,(Magnuson,
1973b); to meet the needs of the type I muscles (red muscles); to guarantee a high endurance
and sustained swimming (Lutcavage et al., 2000a) ; Brill et al., 2002; Royer, 2005); and to
limit energy conflicts. The seasonal variation in surface chlorophyll (a) concentration for the
fishing areas is presented in figs. 14 , 9 as a seasonal average.
Fig. 14. Seasonal variations in bluefin tuna abundances and mean lengths in relation to
environmental factors, chlorophyll (a).
0
500
1000
1500
2000
2500
3000
3500
2000-Tr3 2006-Tr4
2011-Tr4 2003Tr3
2004-Tr3 2011-Tr2 2007-Tr1 2011-Tr3 2017-Tr3 2009-Tr3 2013-Tr1 2014-Tr2
2015-Tr1 2017-Tr4 2007-Tr4 2013-Tr2 2005-Tr3 2015-Tr3 2018-Tr4 2014-Tr1 2001-Tr3 2007-Tr3 2006-Tr3 2014-Tr4 2013-Tr3 2007-Tr2 2014-Tr3 2015-Tr4 2018-Tr1 2010-Tr3 2012-Tr1 2018-Tr3 2012-Tr2 2017-Tr1 2000-Tr2 2008-Tr2 2006-Tr2 2005-Tr4 2001-Tr2_w 2012-Tr3 2012-Tr4 2005-Tr2 2001-Tr2 2016-Tr3 2003-Tr2 2002-Tr2 2000-Tr2_w 2016-Tr4 2009-Tr2 2002-Tr3 2007-Tr2_w 2002-Tr2_w 2015-Tr2 2004-Tr4 2003-Tr2_w 2013-Tr4 2004-Tr2 2008-Tr3 2018-Tr2 2005-Tr1 2004-Tr2_w 2016-Tr1 2017-Tr2 2019-Tr1 2016-Tr2 2019-Tr2 2019-Tr3
210
220
230
240
250
260
270
215,0 296,4
226,1 258,0 233,8 237,5 226,0 255,1 226,0 231,7 247,5 181,1 205,0 223,7 230,6 221,3 260,2 227,8 187,0 230,8 228,0 237,5 225,3 221,3 244,4 163,8 233,8 221,3 219,8 251,3 227,5 237,1 227,5 218,8 185,5 155,9 160,0 254,6
230,7 229,0 142,6 181,7 231,2 179,3 171,0
223,6 146,9 205,0
220,3 257,5
233,2 171,5 245,0 224,5 256,0
225,8 227,1 162,5 226,6 218,7 169,3
Abundance
Time (trimester)
O2
(mmol.m-3)
Lt (cm)
Abundance
O2 (mmol.m-3)
0,00
0,50
1,00
1,50
2,00
2,50
296,43 228,00 226,00 245,00
215,00 142,60 254,56 155,86 258,00
231,67
170,96 163,78 260,24 171,55 181,67 179,34
226,09 233,75
237,50 230,60 159,95 185,54 237,50 146,95 205,00
255,15 225,28 221,31 230,83 247,50 251,33 227,50 218,67 244,38 257,50 162,50 181,06 187,00 227,53 227,82 237,07 230,66 223,65 218,76 219,85
233,84 225,98 256,00 224,48 221,27
169,25 221,25 220,28 227,12 231,24 205,00 225,79 223,62 229,00 233,19 226,55
0
500
1000
1500
2000
2500
3000
3500
2006-Tr4 2001-Tr3 2007-Tr1 2008-Tr3
2000-Tr3 2005-Tr2 2005-Tr4 2008-Tr2 2003Tr3
2009-Tr3 2000-Tr2_w 2004-Tr2_w
2002-Tr2 2007-Tr2 2005-Tr3 2004-Tr2 2001-Tr2 2003-Tr2 2002-Tr2_w 2001-Tr2_w
2011-Tr4 2004-Tr3 2003-Tr2_w
2011-Tr2 2007-Tr4 2006-Tr2 2000-Tr2 2007-Tr3 2009-Tr2 2015-Tr1
2007-Tr2_w
2011-Tr3 2006-Tr3 2013-Tr2 2014-Tr1 2013-Tr1 2010-Tr3 2012-Tr1 2019-Tr2 2013-Tr3 2004-Tr4 2019-Tr1 2014-Tr2 2018-Tr4 2012-Tr2 2015-Tr3 2018-Tr3 2012-Tr3 2017-Tr4 2017-Tr1 2018-Tr1
2014-Tr3 2017-Tr3 2005-Tr1 2018-Tr2 2015-Tr4
2019-Tr3 2014-Tr4 2015-Tr2 2017-Tr2 2016-Tr3 2002-Tr3 2016-Tr1 2016-Tr4 2012-Tr4 2013-Tr4 2016-Tr2
Chl
a
(mg.m-3)
Lt (cm)
Abundance
Time (trimester)
Abundance
Chl a (mg.m-3)