

131
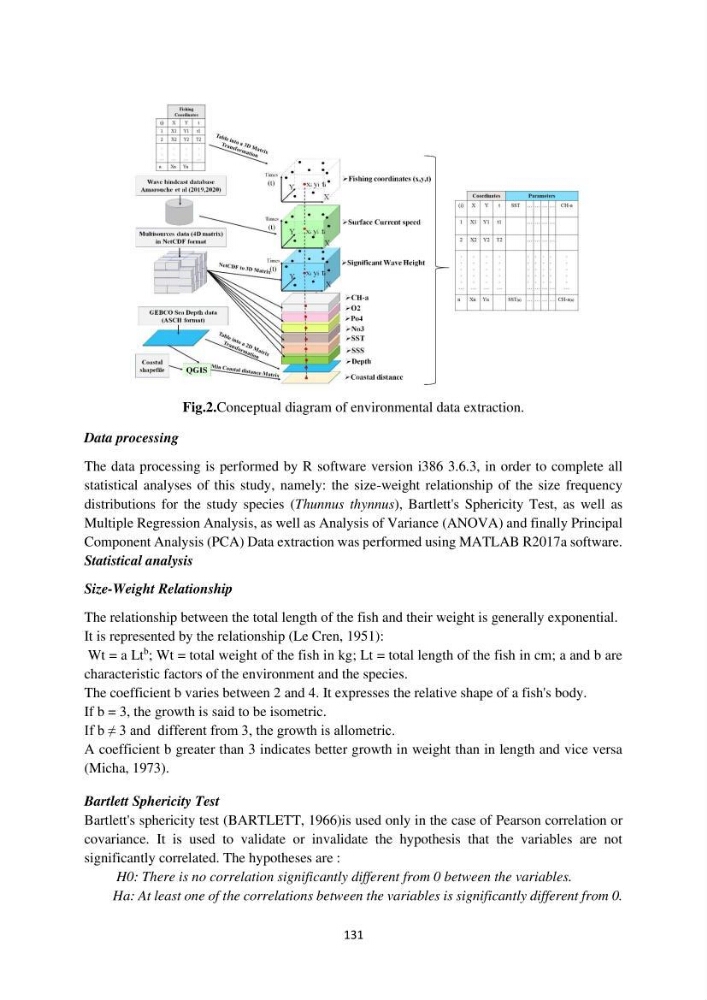
Fig.2.Conceptual diagram of environmental data extraction.
Data processing
The data processing is performed by R software version i386 3.6.3, in order to complete all
statistical analyses of this study, namely: the size-weight relationship of the size frequency
distributions for the study species (Thunnus thynnus), Bartlett's Sphericity Test, as well as
Multiple Regression Analysis, as well as Analysis of Variance (ANOVA) and finally Principal
Component Analysis (PCA) Data extraction was performed using MATLAB R2017a software.
Statistical analysis
Size-Weight Relationship
The relationship between the total length of the fish and their weight is generally exponential.
It is represented by the relationship (Le Cren, 1951):
Wt = a Lt
b ; Wt = total weight of the fish in kg; Lt = total length of the fish in cm; a and b are
characteristic factors of the environment and the species.
The coefficient b varies between 2 and 4. It expresses the relative shape of a fish's body.
If b = 3, the growth is said to be isometric.
If b ≠ 3 and different from 3, the growth is allometric.
A coefficient b greater than 3 indicates better growth in weight than in length and vice versa
(Micha, 1973).
Bartlett Sphericity Test
Bartlett's sphericity test (BARTLETT, 1966)is used only in the case of Pearson correlation or
covariance. It is used to validate or invalidate the hypothesis that the variables are not
significantly correlated. The hypotheses are :
H0: There is no correlation significantly different from 0 between the variables.
Ha: At least one of the correlations between the variables is significantly different from 0.
Fig.2.Conceptual diagram of environmental data extraction.
Data processing
The data processing is performed by R software version i386 3.6.3, in order to complete all
statistical analyses of this study, namely: the size-weight relationship of the size frequency
distributions for the study species (Thunnus thynnus), Bartlett's Sphericity Test, as well as
Multiple Regression Analysis, as well as Analysis of Variance (ANOVA) and finally Principal
Component Analysis (PCA) Data extraction was performed using MATLAB R2017a software.
Statistical analysis
Size-Weight Relationship
The relationship between the total length of the fish and their weight is generally exponential.
It is represented by the relationship (Le Cren, 1951):
Wt = a Lt
b ; Wt = total weight of the fish in kg; Lt = total length of the fish in cm; a and b are
characteristic factors of the environment and the species.
The coefficient b varies between 2 and 4. It expresses the relative shape of a fish's body.
If b = 3, the growth is said to be isometric.
If b ≠ 3 and different from 3, the growth is allometric.
A coefficient b greater than 3 indicates better growth in weight than in length and vice versa
(Micha, 1973).
Bartlett Sphericity Test
Bartlett's sphericity test (BARTLETT, 1966)is used only in the case of Pearson correlation or
covariance. It is used to validate or invalidate the hypothesis that the variables are not
significantly correlated. The hypotheses are :
H0: There is no correlation significantly different from 0 between the variables.
Ha: At least one of the correlations between the variables is significantly different from 0.