

6.2 Methods
99
2009). In the updated version the control variable for land boundary has altered to be
the percentage of the forest land area, with a minimum threshold of 75% (Steffen et al.
2015). But this remains the limitation of incompleteness. To overcome this concern,
we adopt biocapacity, an aggregate indicator that measures the critical thresholds for
biologically productive land use (Wackernagel and Rees 1997), as a proxy of national
land boundaries that are needed to reach self-sufficiency. In contrast to Rockström
et al.’s contention, the biocapacity assumes that the most suitable land available will
be planted to cropland, and that the second, third, fourth, and last choices are forest
land, grassland, fishing ground, and built-up land, respectively (Borucke et al. 2013).
Data for the revised national land boundary per capita are derived from GFN (2012).
6.2.5 Measuring the Sustainability Gap: Two Alternative
Indicators
As yet, neither the footprint metric nor the boundary metric is able to capture both
sides of the sustainability issues; therefore, they should rather be used complementarily to allow for quantitative estimates of the extent to which human pressure or
impact on the environment has approached or exceeded the critical capacity thresholds. This leads to the concept of sustainability gap, which aims at providing policy
makers with a practical measure of anthropogenic interference with the planet’s environment. In principle, a sustainability gap can be measured in two alternative ways,
either by subtracting the footprint metric from the respective boundary metric, or
by dividing the footprint metric by the respective boundary metric. We elaborate on
these in the following subsections. Before that, we define the following symbols:
• F i,j is the converted footprint for environmental issue i for country j.
• B i,j is the converted boundary for environmental issue i for country j.
where the index i runs over carbon, water, and land, and the index j runs over the 28
nations. Because all indicators are measured on an annual basis, the symbols F and
B are expressed in the units of kg CO 2 -eq./yr for carbon, m
3 /yr for water, and ha/yr
for land.
6.2.5.1 Environmental Sustainability Distance (ESD)
The environmental sustainability distance (ESD) refers to the difference between a
footprint and the relevant boundary:
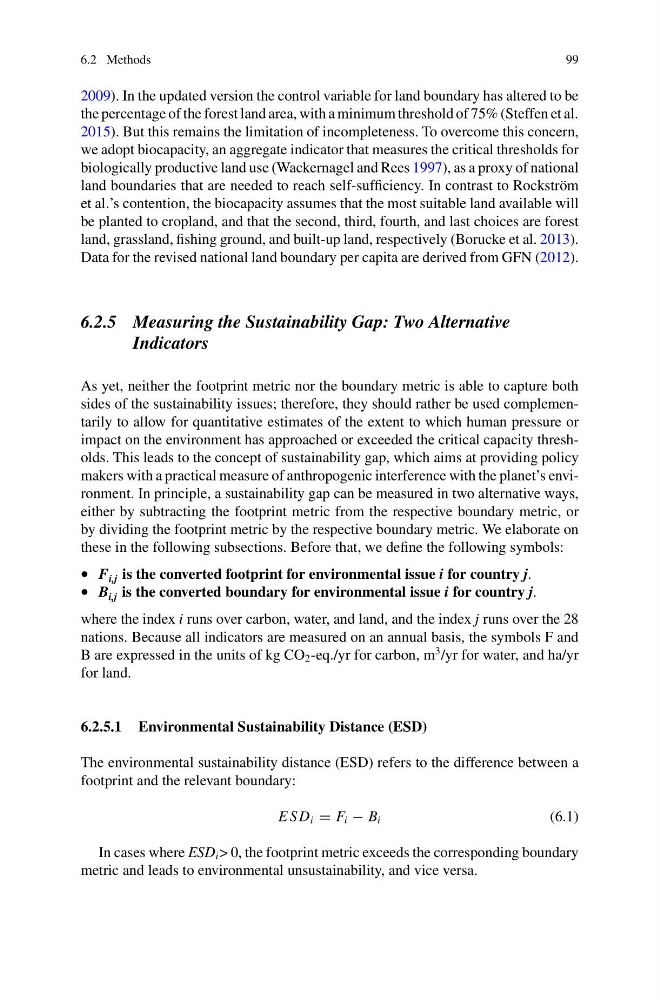
E S D i = F i − B i
(6.1)
In cases where ESD i > 0, the footprint metric exceeds the corresponding boundary
metric and leads to environmental unsustainability, and vice versa.
99
2009). In the updated version the control variable for land boundary has altered to be
the percentage of the forest land area, with a minimum threshold of 75% (Steffen et al.
2015). But this remains the limitation of incompleteness. To overcome this concern,
we adopt biocapacity, an aggregate indicator that measures the critical thresholds for
biologically productive land use (Wackernagel and Rees 1997), as a proxy of national
land boundaries that are needed to reach self-sufficiency. In contrast to Rockström
et al.’s contention, the biocapacity assumes that the most suitable land available will
be planted to cropland, and that the second, third, fourth, and last choices are forest
land, grassland, fishing ground, and built-up land, respectively (Borucke et al. 2013).
Data for the revised national land boundary per capita are derived from GFN (2012).
6.2.5 Measuring the Sustainability Gap: Two Alternative
Indicators
As yet, neither the footprint metric nor the boundary metric is able to capture both
sides of the sustainability issues; therefore, they should rather be used complementarily to allow for quantitative estimates of the extent to which human pressure or
impact on the environment has approached or exceeded the critical capacity thresholds. This leads to the concept of sustainability gap, which aims at providing policy
makers with a practical measure of anthropogenic interference with the planet’s environment. In principle, a sustainability gap can be measured in two alternative ways,
either by subtracting the footprint metric from the respective boundary metric, or
by dividing the footprint metric by the respective boundary metric. We elaborate on
these in the following subsections. Before that, we define the following symbols:
• F i,j is the converted footprint for environmental issue i for country j.
• B i,j is the converted boundary for environmental issue i for country j.
where the index i runs over carbon, water, and land, and the index j runs over the 28
nations. Because all indicators are measured on an annual basis, the symbols F and
B are expressed in the units of kg CO 2 -eq./yr for carbon, m
3 /yr for water, and ha/yr
for land.
6.2.5.1 Environmental Sustainability Distance (ESD)
The environmental sustainability distance (ESD) refers to the difference between a
footprint and the relevant boundary:
E S D i = F i − B i
(6.1)
In cases where ESD i > 0, the footprint metric exceeds the corresponding boundary
metric and leads to environmental unsustainability, and vice versa.