

4 Anthropogenic Water Reservoirs in Poland
65
Table 4.1 (continued)
Reservoir a
Catchment
Water
level
Commissio-ning
date
Key
roles g
Maximum
area [km 2 ]
Total
capacity
[hm 3 ]
48
Pierzchały b
Pasł˛ eka
(–)
1936
E, R 2.4
11.5
49
Myczkowce f
San
15.0 1961
E
2.0
11.0
50
Dzier˙ zno Małe e Drama
(–)
1938
T, R,
F
1.2
10.0
Explanatory notes (–) no data available, a ranked in descending order of total capacity (at
maximum water level); b reservoir impounded by dam, c barrage; d reservoir commissioning year after
modifications; e flooded mineral working; f upper reservoir of a pumped storage power plant; g economic
role (R—tourism and recreation, E—energy generation, F—flood protection, S—water supply, T—
transport or the improvement of navigation conditions, B—fisheries management). (1 hm 3 = 1 mln
m 3 )
Source [11]; amended and supplemented
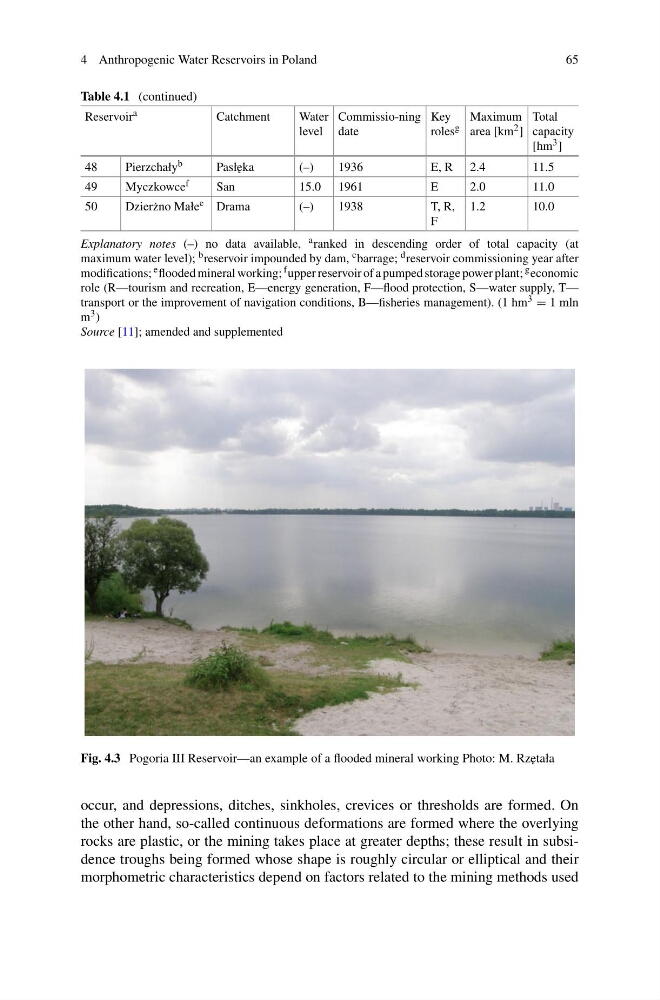
Fig. 4.3 Pogoria III Reservoir—an example of a flooded mineral working Photo: M. Rz˛ etała
occur, and depressions, ditches, sinkholes, crevices or thresholds are formed. On
the other hand, so-called continuous deformations are formed where the overlying
rocks are plastic, or the mining takes place at greater depths; these result in subsidence troughs being formed whose shape is roughly circular or elliptical and their
morphometric characteristics depend on factors related to the mining methods used
65
Table 4.1 (continued)
Reservoir a
Catchment
Water
level
Commissio-ning
date
Key
roles g
Maximum
area [km 2 ]
Total
capacity
[hm 3 ]
48
Pierzchały b
Pasł˛ eka
(–)
1936
E, R 2.4
11.5
49
Myczkowce f
San
15.0 1961
E
2.0
11.0
50
Dzier˙ zno Małe e Drama
(–)
1938
T, R,
F
1.2
10.0
Explanatory notes (–) no data available, a ranked in descending order of total capacity (at
maximum water level); b reservoir impounded by dam, c barrage; d reservoir commissioning year after
modifications; e flooded mineral working; f upper reservoir of a pumped storage power plant; g economic
role (R—tourism and recreation, E—energy generation, F—flood protection, S—water supply, T—
transport or the improvement of navigation conditions, B—fisheries management). (1 hm 3 = 1 mln
m 3 )
Source [11]; amended and supplemented
Fig. 4.3 Pogoria III Reservoir—an example of a flooded mineral working Photo: M. Rz˛ etała
occur, and depressions, ditches, sinkholes, crevices or thresholds are formed. On
the other hand, so-called continuous deformations are formed where the overlying
rocks are plastic, or the mining takes place at greater depths; these result in subsidence troughs being formed whose shape is roughly circular or elliptical and their
morphometric characteristics depend on factors related to the mining methods used