

17 Water Problems in Urban Areas
411
excessive pressure in the network. According to Dohnalik [137], the losses in the
transmission of tap water in 195 cities in Poland amounted to 18.6%. In comparison
with other European countries, this was a satisfactory level, because in Spain it was at
the level of 20% and in France—30%. In extreme cases, these losses were recorded at
60–75%, as it was the cases of Croatia and Albania. There is a sizeable spatial diversity of water losses in Poland, e.g. 80% of cities in the West Pomeranian Voivodeship
province showed losses above 15%, whereas in 75% of cities in Silesian Voivodeship
they exceeded 25% [138]. After 2000, the reduction in the percentage of water loss
(PWS) is observed [139]. It is caused by the modernization of existing water supply
systems in many cities, including the use of plastic pipes (HDPE, PVC), displacing
traditional materials such as grey iron and steel. Failures of the water supply network
in cities located on loess areas cause particularly dangerous effects in the municipal
infrastructure. Then, the suffosion processes are initiated and, as a consequence, the
soil is washed out, voids and channels are created, the foundations are washed, and
construction damage is done, e.g. during a failure in the old town of Sandomierz in
2007.
The reduction in water demand after 1989 resulted in a decrease in the volume of
municipal wastewaters generated and discharged into rivers [41]. However, according
to data from the Central Statistical Office [134], in 2003, treated sewage accounted
for 89% of the volume of all sewage generated in cities in Poland, and in 2016 it was
as high as 96%. In as many as 794 cities, this rate reached 100%, and only in 9 did
not exceed 50% (the smallest: Libi˛ a˙ z—7.1%, Brzeszcze—10.5%). Bearing in mind,
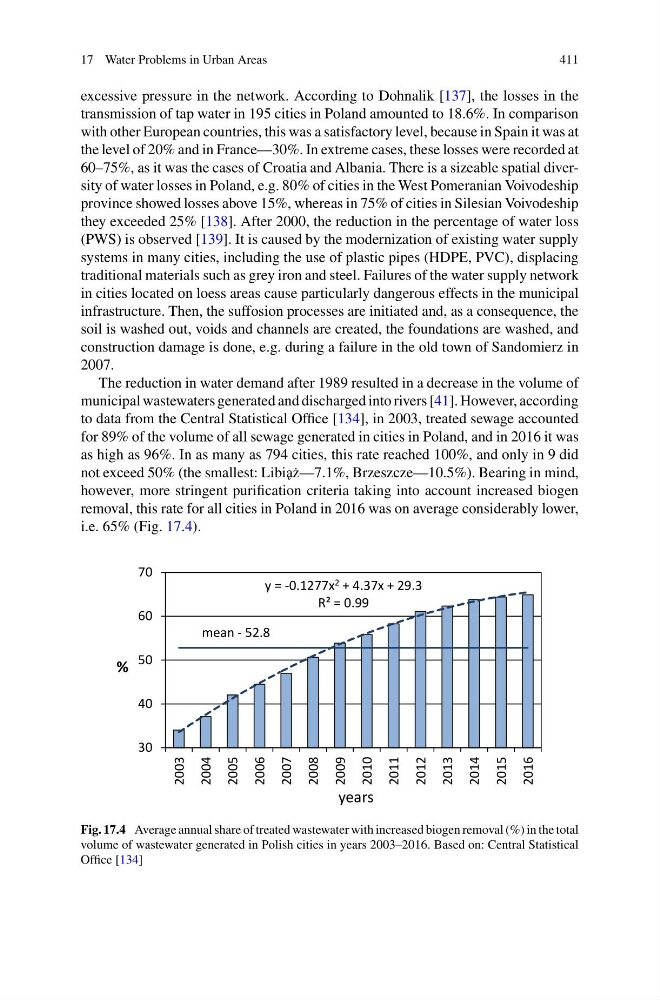
however, more stringent purification criteria taking into account increased biogen
removal, this rate for all cities in Poland in 2016 was on average considerably lower,
i.e. 65% (Fig. 17.4).
y = -0.1277x 2 + 4.37x + 29.3
R² = 0.99
30
40
50
60
70
2003
2004
2005
2006
2007
2008
2009
2010
2011
2012
2013
2014
2015
2016
%
years
mean - 52.8
Fig. 17.4 Average annual share of treated wastewater with increased biogen removal (%) in the total
volume of wastewater generated in Polish cities in years 2003–2016. Based on: Central Statistical
Office [134]
411
excessive pressure in the network. According to Dohnalik [137], the losses in the
transmission of tap water in 195 cities in Poland amounted to 18.6%. In comparison
with other European countries, this was a satisfactory level, because in Spain it was at
the level of 20% and in France—30%. In extreme cases, these losses were recorded at
60–75%, as it was the cases of Croatia and Albania. There is a sizeable spatial diversity of water losses in Poland, e.g. 80% of cities in the West Pomeranian Voivodeship
province showed losses above 15%, whereas in 75% of cities in Silesian Voivodeship
they exceeded 25% [138]. After 2000, the reduction in the percentage of water loss
(PWS) is observed [139]. It is caused by the modernization of existing water supply
systems in many cities, including the use of plastic pipes (HDPE, PVC), displacing
traditional materials such as grey iron and steel. Failures of the water supply network
in cities located on loess areas cause particularly dangerous effects in the municipal
infrastructure. Then, the suffosion processes are initiated and, as a consequence, the
soil is washed out, voids and channels are created, the foundations are washed, and
construction damage is done, e.g. during a failure in the old town of Sandomierz in
2007.
The reduction in water demand after 1989 resulted in a decrease in the volume of
municipal wastewaters generated and discharged into rivers [41]. However, according
to data from the Central Statistical Office [134], in 2003, treated sewage accounted
for 89% of the volume of all sewage generated in cities in Poland, and in 2016 it was
as high as 96%. In as many as 794 cities, this rate reached 100%, and only in 9 did
not exceed 50% (the smallest: Libi˛ a˙ z—7.1%, Brzeszcze—10.5%). Bearing in mind,
however, more stringent purification criteria taking into account increased biogen
removal, this rate for all cities in Poland in 2016 was on average considerably lower,
i.e. 65% (Fig. 17.4).
y = -0.1277x 2 + 4.37x + 29.3
R² = 0.99
30
40
50
60
70
2003
2004
2005
2006
2007
2008
2009
2010
2011
2012
2013
2014
2015
2016
%
years
mean - 52.8
Fig. 17.4 Average annual share of treated wastewater with increased biogen removal (%) in the total
volume of wastewater generated in Polish cities in years 2003–2016. Based on: Central Statistical
Office [134]