

410
T. Ciupa and R. Suligowski
cities about 75% of water was used for industrial purposes (the most in: Konin—1.32
bcm, Ostroł˛ eka—0.42, Skawina—0.26, Police—0.17, Warsaw—0.16).
The average water consumption per capita in Poland in 2016 was 272 m
3 /person
and in all Polish cities—168 m
3 /person [134]. This indicator showed significant variation among individual cities. It was the lowest in small towns in the Małopolskie
Voivodeship (Ryglice—2.2 m
3 /person, Zakliczyn—7.0 m
3 /person), and the highest
in cities with large power stations (Konin—17.7 thousand m
3 /person, Skawina—10.8
thousand m
3 /person), pulp and paper factories (Ostroł˛ eka—8.1 thousand m
3 /person)
and chemical industry plants (Police—5.2 thousand m
3 /person, Puławy—2.1 thousand m
3 /person). According to Piasecki [136], the consumption of water in cities over
500,000 inhabitants is higher than in cities below 10,000 inhabitants. In the latter, it
is determined by low water consumption for industrial purposes resulting from the
small number and sizes of industrial plants. Water consumption for irrigation (lawns,
gardens, and vegetable crops) has also been increasing frequently.
Based on to the data collected from the Central Statistical Office [134], in
cities of individual voivodeships, the average water consumption per capita in 2016
was also strongly diversified, i.e. from 52 m
3 /person in the Łód´ z Voivodeship,
up to 1042 m
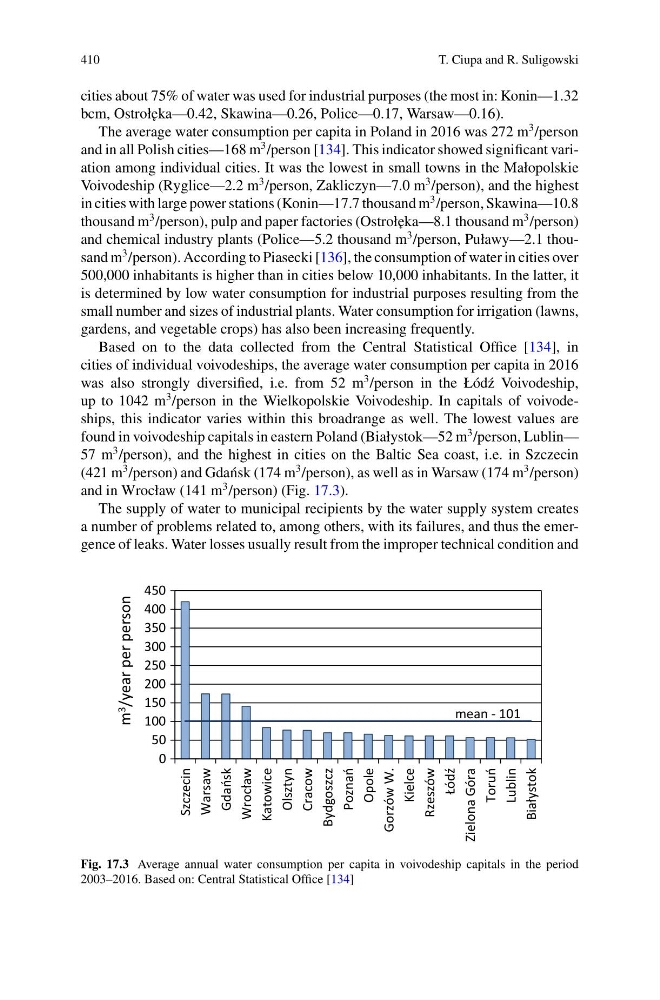
3 /person in the Wielkopolskie Voivodeship. In capitals of voivodeships, this indicator varies within this broadrange as well. The lowest values are
found in voivodeship capitals in eastern Poland (Białystok—52 m
3 /person, Lublin—
57 m
3 /person), and the highest in cities on the Baltic Sea coast, i.e. in Szczecin
(421 m
3 /person) and Gda´ nsk (174 m
3 /person), as well as in Warsaw (174 m
3 /person)
and in Wrocław (141 m
3 /person) (Fig. 17.3).
The supply of water to municipal recipients by the water supply system creates
a number of problems related to, among others, with its failures, and thus the emergence of leaks. Water losses usually result from the improper technical condition and
0
50
100
150
200
250
300
350
400
450
Szczecin
Warsaw
Gdańsk
Wrocław
Katowice
Olsztyn
Cracow
Bydgoszcz
Poznań
Opole
Gorzów W.
Kielce
Rzeszów
Łódź
Zielona Góra
Toruń
Lublin
Białystok
m 3
/year per person
mean - 101
Fig. 17.3 Average annual water consumption per capita in voivodeship capitals in the period
2003–2016. Based on: Central Statistical Office [134]
T. Ciupa and R. Suligowski
cities about 75% of water was used for industrial purposes (the most in: Konin—1.32
bcm, Ostroł˛ eka—0.42, Skawina—0.26, Police—0.17, Warsaw—0.16).
The average water consumption per capita in Poland in 2016 was 272 m
3 /person
and in all Polish cities—168 m
3 /person [134]. This indicator showed significant variation among individual cities. It was the lowest in small towns in the Małopolskie
Voivodeship (Ryglice—2.2 m
3 /person, Zakliczyn—7.0 m
3 /person), and the highest
in cities with large power stations (Konin—17.7 thousand m
3 /person, Skawina—10.8
thousand m
3 /person), pulp and paper factories (Ostroł˛ eka—8.1 thousand m
3 /person)
and chemical industry plants (Police—5.2 thousand m
3 /person, Puławy—2.1 thousand m
3 /person). According to Piasecki [136], the consumption of water in cities over
500,000 inhabitants is higher than in cities below 10,000 inhabitants. In the latter, it
is determined by low water consumption for industrial purposes resulting from the
small number and sizes of industrial plants. Water consumption for irrigation (lawns,
gardens, and vegetable crops) has also been increasing frequently.
Based on to the data collected from the Central Statistical Office [134], in
cities of individual voivodeships, the average water consumption per capita in 2016
was also strongly diversified, i.e. from 52 m
3 /person in the Łód´ z Voivodeship,
up to 1042 m
3 /person in the Wielkopolskie Voivodeship. In capitals of voivodeships, this indicator varies within this broadrange as well. The lowest values are
found in voivodeship capitals in eastern Poland (Białystok—52 m
3 /person, Lublin—
57 m
3 /person), and the highest in cities on the Baltic Sea coast, i.e. in Szczecin
(421 m
3 /person) and Gda´ nsk (174 m
3 /person), as well as in Warsaw (174 m
3 /person)
and in Wrocław (141 m
3 /person) (Fig. 17.3).
The supply of water to municipal recipients by the water supply system creates
a number of problems related to, among others, with its failures, and thus the emergence of leaks. Water losses usually result from the improper technical condition and
0
50
100
150
200
250
300
350
400
450
Szczecin
Warsaw
Gdańsk
Wrocław
Katowice
Olsztyn
Cracow
Bydgoszcz
Poznań
Opole
Gorzów W.
Kielce
Rzeszów
Łódź
Zielona Góra
Toruń
Lublin
Białystok
m 3
/year per person
mean - 101
Fig. 17.3 Average annual water consumption per capita in voivodeship capitals in the period
2003–2016. Based on: Central Statistical Office [134]