

16 The State of Water and Sewage …
385
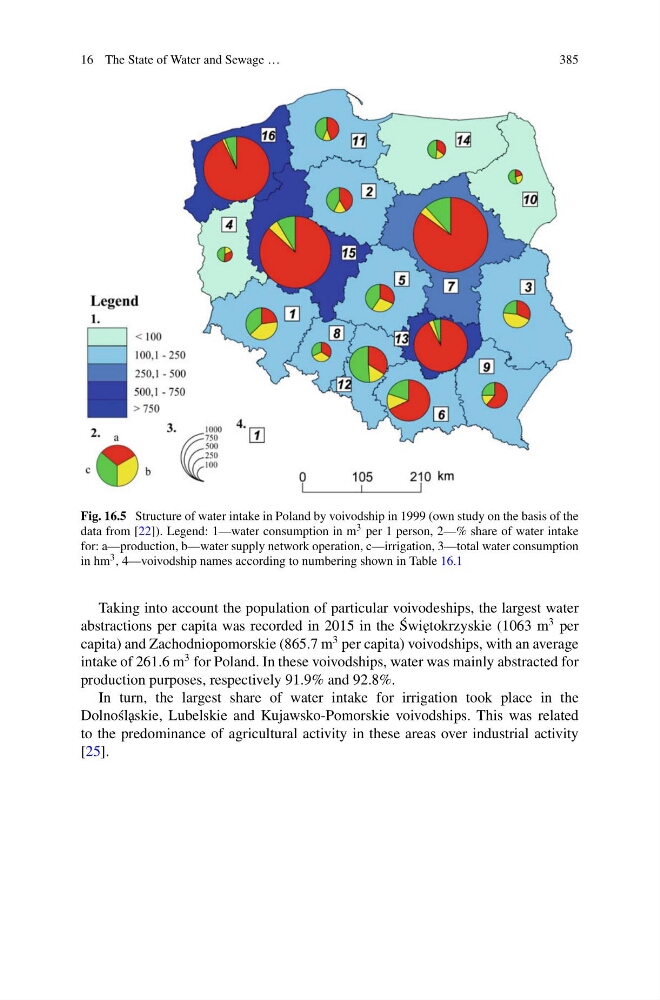
Fig. 16.5 Structure of water intake in Poland by voivodship in 1999 (own study on the basis of the
data from [22]). Legend: 1—water consumption in m 3 per 1 person, 2—% share of water intake
for: a—production, b—water supply network operation, c—irrigation, 3—total water consumption
in hm 3 , 4—voivodship names according to numbering shown in Table 16.1
Taking into account the population of particular voivodeships, the largest water
abstractions per capita was recorded in 2015 in the ´
Swi˛ etokrzyskie (1063 m
3 per
capita) and Zachodniopomorskie (865.7 m
3 per capita) voivodships, with an average
intake of 261.6 m
3 for Poland. In these voivodships, water was mainly abstracted for
production purposes, respectively 91.9% and 92.8%.
In turn, the largest share of water intake for irrigation took place in the
Dolno´ sl˛ askie, Lubelskie and Kujawsko-Pomorskie voivodships. This was related
to the predominance of agricultural activity in these areas over industrial activity
[25].
385
Fig. 16.5 Structure of water intake in Poland by voivodship in 1999 (own study on the basis of the
data from [22]). Legend: 1—water consumption in m 3 per 1 person, 2—% share of water intake
for: a—production, b—water supply network operation, c—irrigation, 3—total water consumption
in hm 3 , 4—voivodship names according to numbering shown in Table 16.1
Taking into account the population of particular voivodeships, the largest water
abstractions per capita was recorded in 2015 in the ´
Swi˛ etokrzyskie (1063 m
3 per
capita) and Zachodniopomorskie (865.7 m
3 per capita) voivodships, with an average
intake of 261.6 m
3 for Poland. In these voivodships, water was mainly abstracted for
production purposes, respectively 91.9% and 92.8%.
In turn, the largest share of water intake for irrigation took place in the
Dolno´ sl˛ askie, Lubelskie and Kujawsko-Pomorskie voivodships. This was related
to the predominance of agricultural activity in these areas over industrial activity
[25].