

378
K. Kubiak-Wójcicka and M. Kielik
using ArcGis software. This allowed for an analysis of the spatial diversity of selected
elements of water and sewerage infrastructure in voivodships.
A detailed analysis of the data was carried out in three selected years, i.e. 1999,
2007 and 2015, which include the years before Poland’s accession to the European
Union and in the years of its functioning within the structures of the EU.
16.3 Characteristics of the Study Area
The total area of the country is 312,679 km
2 . There is a three-level administrative
division of the country in Poland. According to this division, which has been in force
since January 1, 1999, Poland has been divided into 16 voivodships and divided into
smaller administrative units such as poviats and communes. As of January 1, 2015,
there are 314 poviats in Poland, 66 cities with poviat rights and 2,478 communes
[22].
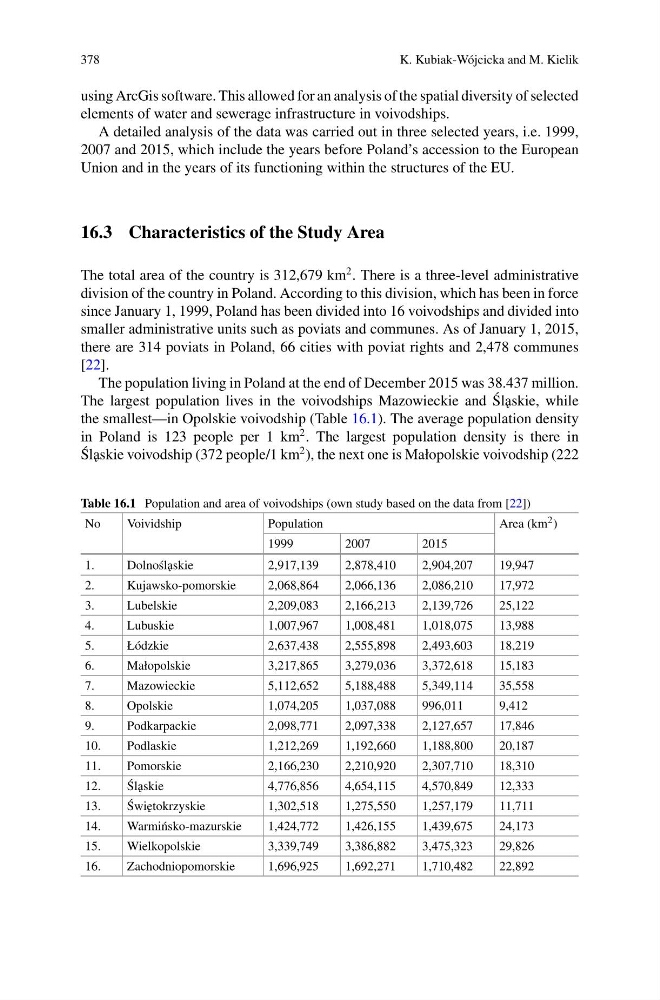
The population living in Poland at the end of December 2015 was 38.437 million.
The largest population lives in the voivodships Mazowieckie and ´
Sl˛ askie, while
the smallest—in Opolskie voivodship (Table 16.1). The average population density
in Poland is 123 people per 1 km
2 . The largest population density is there in
´
Sl˛ askie voivodship (372 people/1 km
2 ), the next one is Małopolskie voivodship (222
Table 16.1 Population and area of voivodships (own study based on the data from [22])
No
Voividship
Population
Area (km 2 )
1999
2007
2015
1.
Dolno´ sl˛ askie
2,917,139
2,878,410
2,904,207
19,947
2.
Kujawsko-pomorskie
2,068,864
2,066,136
2,086,210
17,972
3.
Lubelskie
2,209,083
2,166,213
2,139,726
25,122
4.
Lubuskie
1,007,967
1,008,481
1,018,075
13,988
5.
Łódzkie
2,637,438
2,555,898
2,493,603
18,219
6.
Małopolskie
3,217,865
3,279,036
3,372,618
15,183
7.
Mazowieckie
5,112,652
5,188,488
5,349,114
35,558
8.
Opolskie
1,074,205
1,037,088
996,011
9,412
9.
Podkarpackie
2,098,771
2,097,338
2,127,657
17,846
10.
Podlaskie
1,212,269
1,192,660
1,188,800
20,187
11.
Pomorskie
2,166,230
2,210,920
2,307,710
18,310
12.
´
Sl˛ askie
4,776,856
4,654,115
4,570,849
12,333
13.
´
Swi˛ etokrzyskie
1,302,518
1,275,550
1,257,179
11,711
14.
Warmi´ nsko-mazurskie
1,424,772
1,426,155
1,439,675
24,173
15.
Wielkopolskie
3,339,749
3,386,882
3,475,323
29,826
16.
Zachodniopomorskie
1,696,925
1,692,271
1,710,482
22,892
K. Kubiak-Wójcicka and M. Kielik
using ArcGis software. This allowed for an analysis of the spatial diversity of selected
elements of water and sewerage infrastructure in voivodships.
A detailed analysis of the data was carried out in three selected years, i.e. 1999,
2007 and 2015, which include the years before Poland’s accession to the European
Union and in the years of its functioning within the structures of the EU.
16.3 Characteristics of the Study Area
The total area of the country is 312,679 km
2 . There is a three-level administrative
division of the country in Poland. According to this division, which has been in force
since January 1, 1999, Poland has been divided into 16 voivodships and divided into
smaller administrative units such as poviats and communes. As of January 1, 2015,
there are 314 poviats in Poland, 66 cities with poviat rights and 2,478 communes
[22].
The population living in Poland at the end of December 2015 was 38.437 million.
The largest population lives in the voivodships Mazowieckie and ´
Sl˛ askie, while
the smallest—in Opolskie voivodship (Table 16.1). The average population density
in Poland is 123 people per 1 km
2 . The largest population density is there in
´
Sl˛ askie voivodship (372 people/1 km
2 ), the next one is Małopolskie voivodship (222
Table 16.1 Population and area of voivodships (own study based on the data from [22])
No
Voividship
Population
Area (km 2 )
1999
2007
2015
1.
Dolno´ sl˛ askie
2,917,139
2,878,410
2,904,207
19,947
2.
Kujawsko-pomorskie
2,068,864
2,066,136
2,086,210
17,972
3.
Lubelskie
2,209,083
2,166,213
2,139,726
25,122
4.
Lubuskie
1,007,967
1,008,481
1,018,075
13,988
5.
Łódzkie
2,637,438
2,555,898
2,493,603
18,219
6.
Małopolskie
3,217,865
3,279,036
3,372,618
15,183
7.
Mazowieckie
5,112,652
5,188,488
5,349,114
35,558
8.
Opolskie
1,074,205
1,037,088
996,011
9,412
9.
Podkarpackie
2,098,771
2,097,338
2,127,657
17,846
10.
Podlaskie
1,212,269
1,192,660
1,188,800
20,187
11.
Pomorskie
2,166,230
2,210,920
2,307,710
18,310
12.
´
Sl˛ askie
4,776,856
4,654,115
4,570,849
12,333
13.
´
Swi˛ etokrzyskie
1,302,518
1,275,550
1,257,179
11,711
14.
Warmi´ nsko-mazurskie
1,424,772
1,426,155
1,439,675
24,173
15.
Wielkopolskie
3,339,749
3,386,882
3,475,323
29,826
16.
Zachodniopomorskie
1,696,925
1,692,271
1,710,482
22,892