

354
M. Kejna et al.
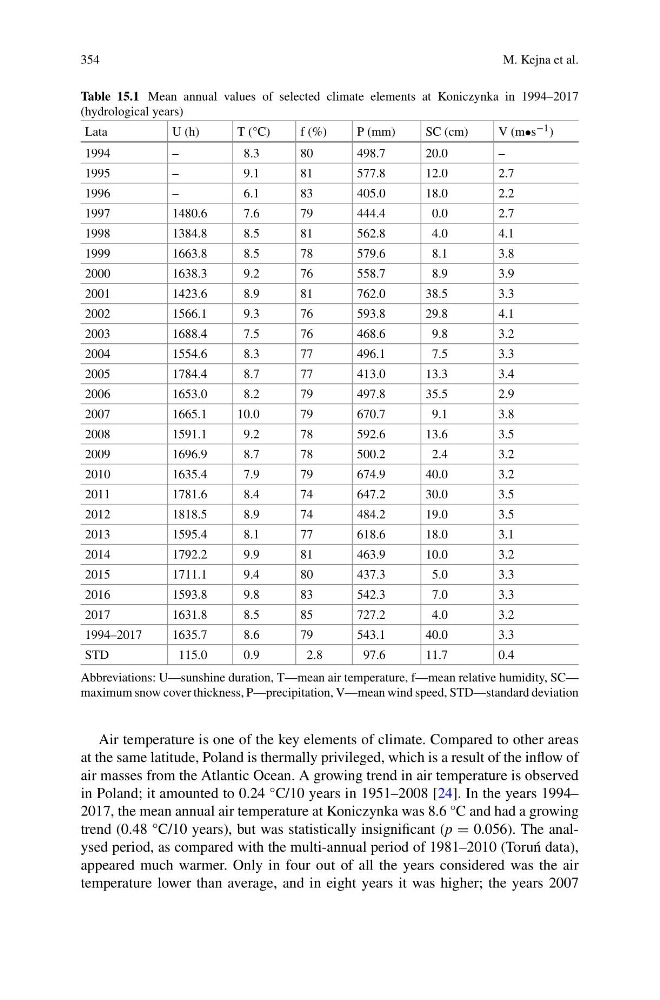
Table 15.1 Mean annual values of selected climate elements at Koniczynka in 1994–2017
(hydrological years)
Lata
U (h)
T (°C)
f (%)
P (mm)
SC (cm)
V (m•s −1 )
1994
–
8.3
80
498.7
20.0
–
1995
–
9.1
81
577.8
12.0
2.7
1996
–
6.1
83
405.0
18.0
2.2
1997
1480.6
7.6
79
444.4
0.0
2.7
1998
1384.8
8.5
81
562.8
4.0
4.1
1999
1663.8
8.5
78
579.6
8.1
3.8
2000
1638.3
9.2
76
558.7
8.9
3.9
2001
1423.6
8.9
81
762.0
38.5
3.3
2002
1566.1
9.3
76
593.8
29.8
4.1
2003
1688.4
7.5
76
468.6
9.8
3.2
2004
1554.6
8.3
77
496.1
7.5
3.3
2005
1784.4
8.7
77
413.0
13.3
3.4
2006
1653.0
8.2
79
497.8
35.5
2.9
2007
1665.1
10.0
79
670.7
9.1
3.8
2008
1591.1
9.2
78
592.6
13.6
3.5
2009
1696.9
8.7
78
500.2
2.4
3.2
2010
1635.4
7.9
79
674.9
40.0
3.2
2011
1781.6
8.4
74
647.2
30.0
3.5
2012
1818.5
8.9
74
484.2
19.0
3.5
2013
1595.4
8.1
77
618.6
18.0
3.1
2014
1792.2
9.9
81
463.9
10.0
3.2
2015
1711.1
9.4
80
437.3
5.0
3.3
2016
1593.8
9.8
83
542.3
7.0
3.3
2017
1631.8
8.5
85
727.2
4.0
3.2
1994–2017
1635.7
8.6
79
543.1
40.0
3.3
STD
115.0
0.9
2.8
97.6
11.7
0.4
Abbreviations: U—sunshine duration, T—mean air temperature, f—mean relative humidity, SC—
maximum snow cover thickness, P—precipitation, V—mean wind speed, STD—standard deviation
Air temperature is one of the key elements of climate. Compared to other areas
at the same latitude, Poland is thermally privileged, which is a result of the inflow of
air masses from the Atlantic Ocean. A growing trend in air temperature is observed
in Poland; it amounted to 0.24 °C/10 years in 1951–2008 [24]. In the years 1994–
2017, the mean annual air temperature at Koniczynka was 8.6 °C and had a growing
trend (0.48 °C/10 years), but was statistically insignificant (p = 0.056). The analysed period, as compared with the multi-annual period of 1981–2010 (Toru´ n data),
appeared much warmer. Only in four out of all the years considered was the air
temperature lower than average, and in eight years it was higher; the years 2007
M. Kejna et al.
Table 15.1 Mean annual values of selected climate elements at Koniczynka in 1994–2017
(hydrological years)
Lata
U (h)
T (°C)
f (%)
P (mm)
SC (cm)
V (m•s −1 )
1994
–
8.3
80
498.7
20.0
–
1995
–
9.1
81
577.8
12.0
2.7
1996
–
6.1
83
405.0
18.0
2.2
1997
1480.6
7.6
79
444.4
0.0
2.7
1998
1384.8
8.5
81
562.8
4.0
4.1
1999
1663.8
8.5
78
579.6
8.1
3.8
2000
1638.3
9.2
76
558.7
8.9
3.9
2001
1423.6
8.9
81
762.0
38.5
3.3
2002
1566.1
9.3
76
593.8
29.8
4.1
2003
1688.4
7.5
76
468.6
9.8
3.2
2004
1554.6
8.3
77
496.1
7.5
3.3
2005
1784.4
8.7
77
413.0
13.3
3.4
2006
1653.0
8.2
79
497.8
35.5
2.9
2007
1665.1
10.0
79
670.7
9.1
3.8
2008
1591.1
9.2
78
592.6
13.6
3.5
2009
1696.9
8.7
78
500.2
2.4
3.2
2010
1635.4
7.9
79
674.9
40.0
3.2
2011
1781.6
8.4
74
647.2
30.0
3.5
2012
1818.5
8.9
74
484.2
19.0
3.5
2013
1595.4
8.1
77
618.6
18.0
3.1
2014
1792.2
9.9
81
463.9
10.0
3.2
2015
1711.1
9.4
80
437.3
5.0
3.3
2016
1593.8
9.8
83
542.3
7.0
3.3
2017
1631.8
8.5
85
727.2
4.0
3.2
1994–2017
1635.7
8.6
79
543.1
40.0
3.3
STD
115.0
0.9
2.8
97.6
11.7
0.4
Abbreviations: U—sunshine duration, T—mean air temperature, f—mean relative humidity, SC—
maximum snow cover thickness, P—precipitation, V—mean wind speed, STD—standard deviation
Air temperature is one of the key elements of climate. Compared to other areas
at the same latitude, Poland is thermally privileged, which is a result of the inflow of
air masses from the Atlantic Ocean. A growing trend in air temperature is observed
in Poland; it amounted to 0.24 °C/10 years in 1951–2008 [24]. In the years 1994–
2017, the mean annual air temperature at Koniczynka was 8.6 °C and had a growing
trend (0.48 °C/10 years), but was statistically insignificant (p = 0.056). The analysed period, as compared with the multi-annual period of 1981–2010 (Toru´ n data),
appeared much warmer. Only in four out of all the years considered was the air
temperature lower than average, and in eight years it was higher; the years 2007