

330
E. Neverova-Dziopak
Table 14.5 (continued)
Criterion
Trophic state
Author
Oligotrophic Mesotrophic Eutrophic Hypertrophic
1
2
3
4
5
6
>10
5–10
<2
<1.5
Vant
>8
4–2
1.5–5.0
0.25–0.5
Carlsona
>6
6–3
0.5–1
<1.5
OECD
Total
phosphorus
concentration,
TP.µg/dm 3
5–20
5–50
100
–
Romanienko
5–10
10–30
30–100
>100
Vollenweider
<15
15–25
25–100
>100
Foresberg, Ryding
<10
10.0–35.0
35–100
>100
OECD
<11.0
1.00–21.1
>21.7
>100
Chapry and
Dobbson
<10
10–30
30–100
>100
Nurnberg
<25
15–25
25–100
>96
Forsberga i
Rydinga
4.1–9.0
9.0–20
20–43
–
Burnsa
<9.9
9.9–18.5
>18.5
–
Dillona i Riglera
<10
10–20
20–50
>50
Vant
<6
12–24
48–96
96–192
Carlsona
8.0
25.0
80.0
>100
Moss
Total nitrogen
concentration
TN, µg/dm 3
5–80
80–500
500–1500 –
Romanienko
<400
400–600
600–1500 >1500
Foresberg, Ryding
<350
350–650
650–1200 >1200
Nurnbrg
<400
400–600
600–1500 >1500
Forsberga i
Rydinga
73–157
157–337
337–725 >1558
Burns
<200
200–300
300–500 >500
Vant
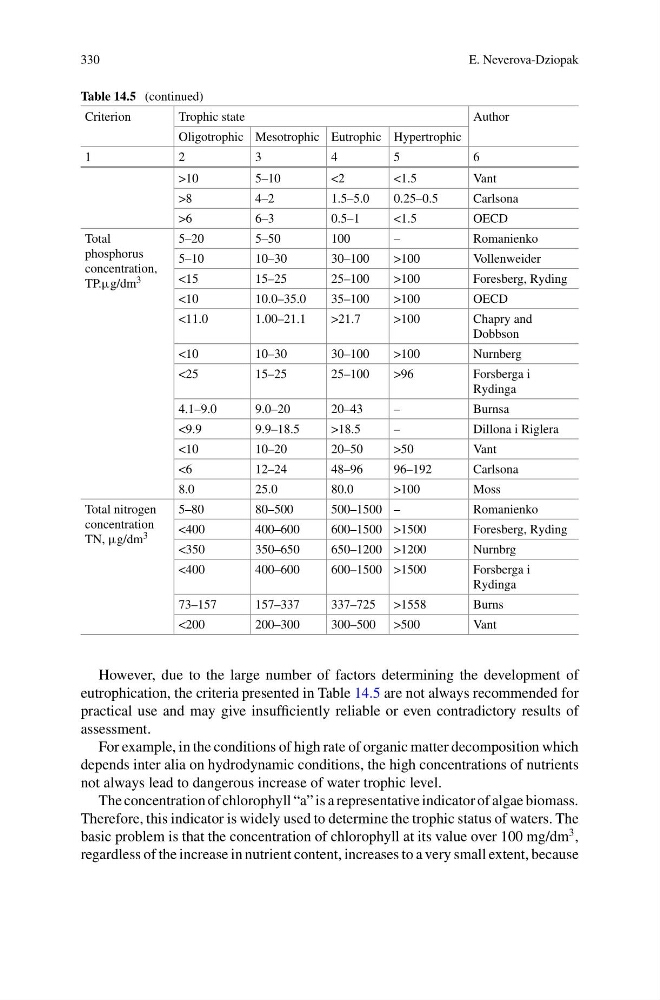
However, due to the large number of factors determining the development of
eutrophication, the criteria presented in Table 14.5 are not always recommended for
practical use and may give insufficiently reliable or even contradictory results of
assessment.
For example, in the conditions of high rate of organic matter decomposition which
depends inter alia on hydrodynamic conditions, the high concentrations of nutrients
not always lead to dangerous increase of water trophic level.
The concentration of chlorophyll “a” is a representative indicator of algae biomass.
Therefore, this indicator is widely used to determine the trophic status of waters. The
basic problem is that the concentration of chlorophyll at its value over 100 mg/dm
3 ,
regardless of the increase in nutrient content, increases to a very small extent, because
E. Neverova-Dziopak
Table 14.5 (continued)
Criterion
Trophic state
Author
Oligotrophic Mesotrophic Eutrophic Hypertrophic
1
2
3
4
5
6
>10
5–10
<2
<1.5
Vant
>8
4–2
1.5–5.0
0.25–0.5
Carlsona
>6
6–3
0.5–1
<1.5
OECD
Total
phosphorus
concentration,
TP.µg/dm 3
5–20
5–50
100
–
Romanienko
5–10
10–30
30–100
>100
Vollenweider
<15
15–25
25–100
>100
Foresberg, Ryding
<10
10.0–35.0
35–100
>100
OECD
<11.0
1.00–21.1
>21.7
>100
Chapry and
Dobbson
<10
10–30
30–100
>100
Nurnberg
<25
15–25
25–100
>96
Forsberga i
Rydinga
4.1–9.0
9.0–20
20–43
–
Burnsa
<9.9
9.9–18.5
>18.5
–
Dillona i Riglera
<10
10–20
20–50
>50
Vant
<6
12–24
48–96
96–192
Carlsona
8.0
25.0
80.0
>100
Moss
Total nitrogen
concentration
TN, µg/dm 3
5–80
80–500
500–1500 –
Romanienko
<400
400–600
600–1500 >1500
Foresberg, Ryding
<350
350–650
650–1200 >1200
Nurnbrg
<400
400–600
600–1500 >1500
Forsberga i
Rydinga
73–157
157–337
337–725 >1558
Burns
<200
200–300
300–500 >500
Vant
However, due to the large number of factors determining the development of
eutrophication, the criteria presented in Table 14.5 are not always recommended for
practical use and may give insufficiently reliable or even contradictory results of
assessment.
For example, in the conditions of high rate of organic matter decomposition which
depends inter alia on hydrodynamic conditions, the high concentrations of nutrients
not always lead to dangerous increase of water trophic level.
The concentration of chlorophyll “a” is a representative indicator of algae biomass.
Therefore, this indicator is widely used to determine the trophic status of waters. The
basic problem is that the concentration of chlorophyll at its value over 100 mg/dm
3 ,
regardless of the increase in nutrient content, increases to a very small extent, because