

9 Assessment of Pollution of Water Resources and Process of Pollution Spreading
207
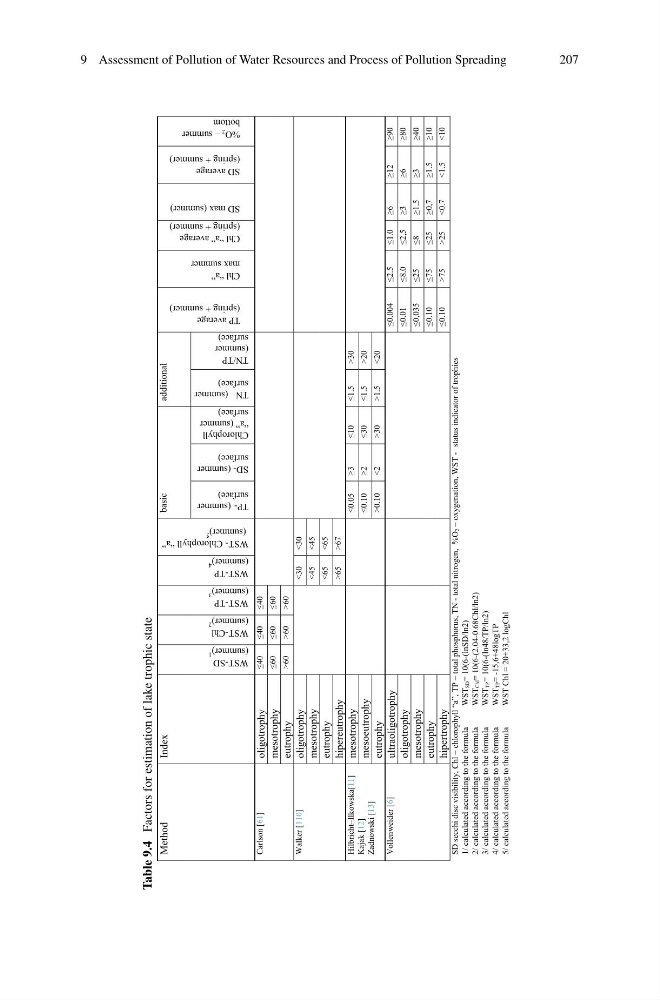
Table 9.4
Factors for estimation of lake trophic state
Method
Index
WST-SD
(summer) 1
WST-Chl
(summer) 2
WST-TP
(summer) 3
WST-TP
(summer) 4
WST- Chlorophyll “a”
(summer) 5
basic
additional
TP average
(spring + summer)
Chl “a”
max summer
Chl “a” average
(spring + summer)
SD max (summer)
SD average
(spring + summer)
%O 2 – summer
bottom
TP- (summer
surface)
SD- (summer
surface)
Chlorophyll
“a” (summer
surface)
TN (summer
surface)
TN/TP
(summer
surface)
Carlson [61]
oligotrophy
≤40
≤40
≤40
mesotrophy
≤60
≤60
≤60
eutrophy
>60
>60
>60
Walker [110]
oligotrophy
<30
<30
mesotrophy
<45
<45
eutrophy
<65
<65
hipereutrophy
>65
>67
Hilbricht–Ilkowska[11]
Kajak [12]
Zadnowski [13]
mesotrophy
≤0.05
≥3
≤10
≤1.5
>30
mesoeutrophy
≤0.10
≥2
≤30
≤1.5
>20
eutrophy
>0.10
<2
>30
>1.5
<20
Vollenweider [6]
ultraoligotrophy
≤0.004
≤2.5
≤1.0
≥6
≥12
≥90
oligotrophy
≤0.01
≤8.0
≤2,5
≥3
≥6
≥80
mesotrophy
≤0,035
≤25
≤8
≥1.5
≥3
≥40
eutrophy
≤0.10
≤75
≤25
≥0,7
≥1.5
≥10
hipertrophy
≤0.10
>75
>25
<0.7
<1.5
<10
SD secchi disc visibility, Chl – chlorophyll “a”, TP – total phosphorus, TN - total nitrogen, %O2 – oxygenation, WST - status indicator of trophies
1/ calculated according to the formula
WSTSD=
10(6-(lnSD/ln2)
2/ calculated according to the formula
WSTChl=
10(6-(2.04-0.68Chl/ln2)
3/ calculated according to the formula
WSTTP= 10(6-(ln48/TP/ln2)
4/ calculated according to the formula
WSTTP= -15,6+48logTP
5/ calculated according to the formula
WST Chl = 20+33,2 logChl
207
Table 9.4
Factors for estimation of lake trophic state
Method
Index
WST-SD
(summer) 1
WST-Chl
(summer) 2
WST-TP
(summer) 3
WST-TP
(summer) 4
WST- Chlorophyll “a”
(summer) 5
basic
additional
TP average
(spring + summer)
Chl “a”
max summer
Chl “a” average
(spring + summer)
SD max (summer)
SD average
(spring + summer)
%O 2 – summer
bottom
TP- (summer
surface)
SD- (summer
surface)
Chlorophyll
“a” (summer
surface)
TN (summer
surface)
TN/TP
(summer
surface)
Carlson [61]
oligotrophy
≤40
≤40
≤40
mesotrophy
≤60
≤60
≤60
eutrophy
>60
>60
>60
Walker [110]
oligotrophy
<30
<30
mesotrophy
<45
<45
eutrophy
<65
<65
hipereutrophy
>65
>67
Hilbricht–Ilkowska[11]
Kajak [12]
Zadnowski [13]
mesotrophy
≤0.05
≥3
≤10
≤1.5
>30
mesoeutrophy
≤0.10
≥2
≤30
≤1.5
>20
eutrophy
>0.10
<2
>30
>1.5
<20
Vollenweider [6]
ultraoligotrophy
≤0.004
≤2.5
≤1.0
≥6
≥12
≥90
oligotrophy
≤0.01
≤8.0
≤2,5
≥3
≥6
≥80
mesotrophy
≤0,035
≤25
≤8
≥1.5
≥3
≥40
eutrophy
≤0.10
≤75
≤25
≥0,7
≥1.5
≥10
hipertrophy
≤0.10
>75
>25
<0.7
<1.5
<10
SD secchi disc visibility, Chl – chlorophyll “a”, TP – total phosphorus, TN - total nitrogen, %O2 – oxygenation, WST - status indicator of trophies
1/ calculated according to the formula
WSTSD=
10(6-(lnSD/ln2)
2/ calculated according to the formula
WSTChl=
10(6-(2.04-0.68Chl/ln2)
3/ calculated according to the formula
WSTTP= 10(6-(ln48/TP/ln2)
4/ calculated according to the formula
WSTTP= -15,6+48logTP
5/ calculated according to the formula
WST Chl = 20+33,2 logChl