

8 Water Quality and Ecosystem Modelling …
179
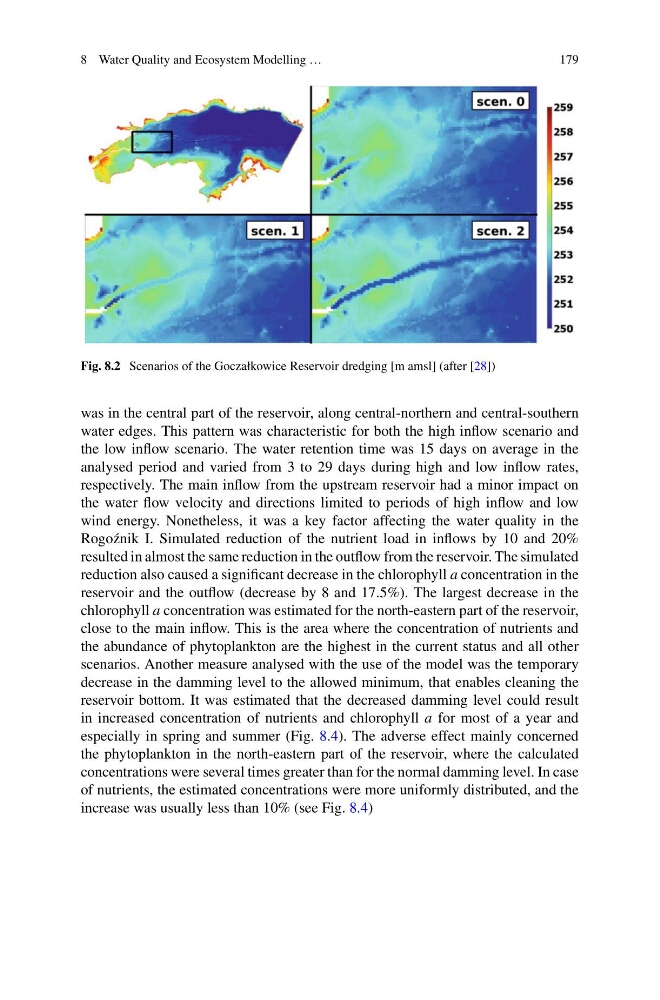
Fig. 8.2 Scenarios of the Goczałkowice Reservoir dredging [m amsl] (after [28])
was in the central part of the reservoir, along central-northern and central-southern
water edges. This pattern was characteristic for both the high inflow scenario and
the low inflow scenario. The water retention time was 15 days on average in the
analysed period and varied from 3 to 29 days during high and low inflow rates,
respectively. The main inflow from the upstream reservoir had a minor impact on
the water flow velocity and directions limited to periods of high inflow and low
wind energy. Nonetheless, it was a key factor affecting the water quality in the
Rogo´ znik I. Simulated reduction of the nutrient load in inflows by 10 and 20%
resulted in almost the same reduction in the outflow from the reservoir. The simulated
reduction also caused a significant decrease in the chlorophyll a concentration in the
reservoir and the outflow (decrease by 8 and 17.5%). The largest decrease in the
chlorophyll a concentration was estimated for the north-eastern part of the reservoir,
close to the main inflow. This is the area where the concentration of nutrients and
the abundance of phytoplankton are the highest in the current status and all other
scenarios. Another measure analysed with the use of the model was the temporary
decrease in the damming level to the allowed minimum, that enables cleaning the
reservoir bottom. It was estimated that the decreased damming level could result
in increased concentration of nutrients and chlorophyll a for most of a year and
especially in spring and summer (Fig. 8.4). The adverse effect mainly concerned
the phytoplankton in the north-eastern part of the reservoir, where the calculated
concentrations were several times greater than for the normal damming level. In case
of nutrients, the estimated concentrations were more uniformly distributed, and the
increase was usually less than 10% (see Fig. 8.4)
179
Fig. 8.2 Scenarios of the Goczałkowice Reservoir dredging [m amsl] (after [28])
was in the central part of the reservoir, along central-northern and central-southern
water edges. This pattern was characteristic for both the high inflow scenario and
the low inflow scenario. The water retention time was 15 days on average in the
analysed period and varied from 3 to 29 days during high and low inflow rates,
respectively. The main inflow from the upstream reservoir had a minor impact on
the water flow velocity and directions limited to periods of high inflow and low
wind energy. Nonetheless, it was a key factor affecting the water quality in the
Rogo´ znik I. Simulated reduction of the nutrient load in inflows by 10 and 20%
resulted in almost the same reduction in the outflow from the reservoir. The simulated
reduction also caused a significant decrease in the chlorophyll a concentration in the
reservoir and the outflow (decrease by 8 and 17.5%). The largest decrease in the
chlorophyll a concentration was estimated for the north-eastern part of the reservoir,
close to the main inflow. This is the area where the concentration of nutrients and
the abundance of phytoplankton are the highest in the current status and all other
scenarios. Another measure analysed with the use of the model was the temporary
decrease in the damming level to the allowed minimum, that enables cleaning the
reservoir bottom. It was estimated that the decreased damming level could result
in increased concentration of nutrients and chlorophyll a for most of a year and
especially in spring and summer (Fig. 8.4). The adverse effect mainly concerned
the phytoplankton in the north-eastern part of the reservoir, where the calculated
concentrations were several times greater than for the normal damming level. In case
of nutrients, the estimated concentrations were more uniformly distributed, and the
increase was usually less than 10% (see Fig. 8.4)