

7 Water Quality in Main Dam Reservoirs in Poland
165
-80
-70
-60
-50
-40
-30
-20
-10
0
10
ConducƟvity
pH
Temperature of water
Dissolved oxygen
Chloride
Nitrate
[%]
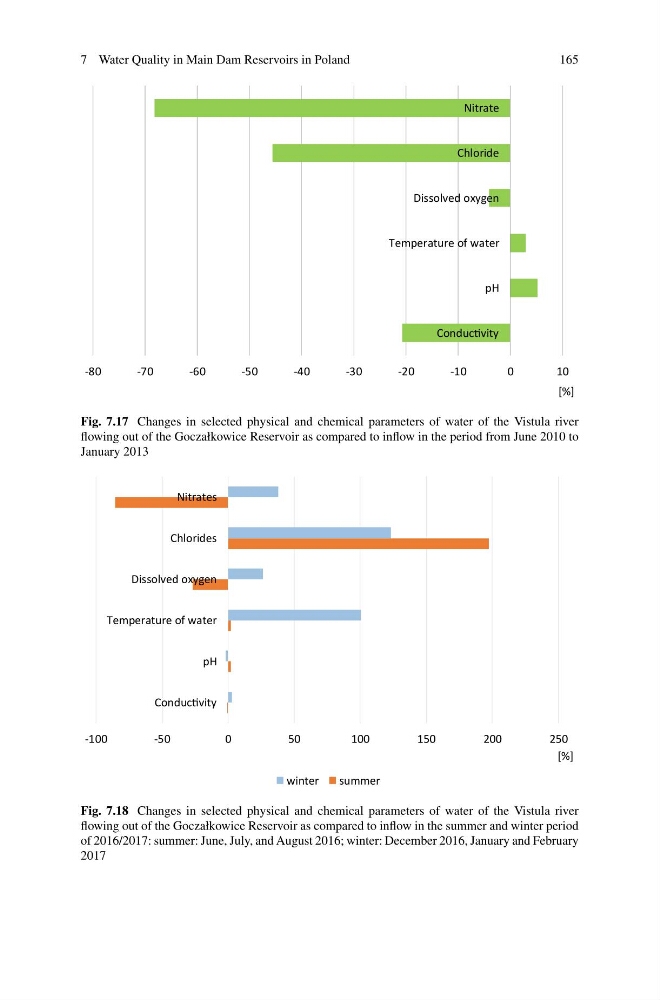
Fig. 7.17 Changes in selected physical and chemical parameters of water of the Vistula river
flowing out of the Goczałkowice Reservoir as compared to inflow in the period from June 2010 to
January 2013
-100
-50
0
50
100
150
200
250
ConducƟvity
pH
Temperature of water
Dissolved oxygen
Chlorides
Nitrates
[%]
winter
summer
Fig. 7.18 Changes in selected physical and chemical parameters of water of the Vistula river
flowing out of the Goczałkowice Reservoir as compared to inflow in the summer and winter period
of 2016/2017: summer: June, July, and August 2016; winter: December 2016, January and February
2017
165
-80
-70
-60
-50
-40
-30
-20
-10
0
10
ConducƟvity
pH
Temperature of water
Dissolved oxygen
Chloride
Nitrate
[%]
Fig. 7.17 Changes in selected physical and chemical parameters of water of the Vistula river
flowing out of the Goczałkowice Reservoir as compared to inflow in the period from June 2010 to
January 2013
-100
-50
0
50
100
150
200
250
ConducƟvity
pH
Temperature of water
Dissolved oxygen
Chlorides
Nitrates
[%]
winter
summer
Fig. 7.18 Changes in selected physical and chemical parameters of water of the Vistula river
flowing out of the Goczałkowice Reservoir as compared to inflow in the summer and winter period
of 2016/2017: summer: June, July, and August 2016; winter: December 2016, January and February
2017