

7 Water Quality in Main Dam Reservoirs in Poland
153
coal mines. Concentrations of chlorides and sulphates are a few times higher than in
other reservoirs.
Total nitrogen and total phosphorus are indexes characterising biogenic conditions. High values of biogenic substances in reservoirs, particularly phosphorus,
lead to their eutrophication, often triggering algal bloom in the water of dam reservoirs. Poland-wide the main factor causing nitrogen and phosphorus pollution from
dispersed (or nonpoint) sources is agriculture, producing 79.24% of nitrogen load
and 96.7% of phosphorus load. The limit value for total nitrogen for class I of water
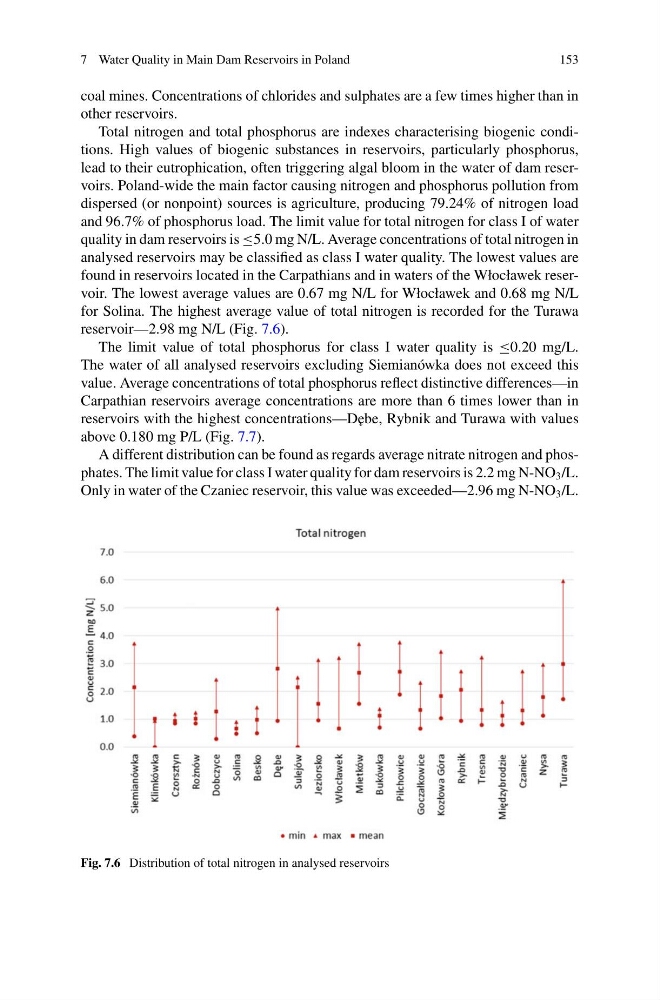
quality in dam reservoirs is ≤5.0 mg N/L. Average concentrations of total nitrogen in
analysed reservoirs may be classified as class I water quality. The lowest values are
found in reservoirs located in the Carpathians and in waters of the Włocławek reservoir. The lowest average values are 0.67 mg N/L for Włocławek and 0.68 mg N/L
for Solina. The highest average value of total nitrogen is recorded for the Turawa
reservoir—2.98 mg N/L (Fig. 7.6).
The limit value of total phosphorus for class I water quality is ≤0.20 mg/L.
The water of all analysed reservoirs excluding Siemianówka does not exceed this
value. Average concentrations of total phosphorus reflect distinctive differences—in
Carpathian reservoirs average concentrations are more than 6 times lower than in
reservoirs with the highest concentrations—D˛ ebe, Rybnik and Turawa with values
above 0.180 mg P/L (Fig. 7.7).
A different distribution can be found as regards average nitrate nitrogen and phosphates. The limit value for class I water quality for dam reservoirs is 2.2 mg N-NO 3 /L.
Only in water of the Czaniec reservoir, this value was exceeded—2.96 mg N-NO 3 /L.
Fig. 7.6 Distribution of total nitrogen in analysed reservoirs
153
coal mines. Concentrations of chlorides and sulphates are a few times higher than in
other reservoirs.
Total nitrogen and total phosphorus are indexes characterising biogenic conditions. High values of biogenic substances in reservoirs, particularly phosphorus,
lead to their eutrophication, often triggering algal bloom in the water of dam reservoirs. Poland-wide the main factor causing nitrogen and phosphorus pollution from
dispersed (or nonpoint) sources is agriculture, producing 79.24% of nitrogen load
and 96.7% of phosphorus load. The limit value for total nitrogen for class I of water
quality in dam reservoirs is ≤5.0 mg N/L. Average concentrations of total nitrogen in
analysed reservoirs may be classified as class I water quality. The lowest values are
found in reservoirs located in the Carpathians and in waters of the Włocławek reservoir. The lowest average values are 0.67 mg N/L for Włocławek and 0.68 mg N/L
for Solina. The highest average value of total nitrogen is recorded for the Turawa
reservoir—2.98 mg N/L (Fig. 7.6).
The limit value of total phosphorus for class I water quality is ≤0.20 mg/L.
The water of all analysed reservoirs excluding Siemianówka does not exceed this
value. Average concentrations of total phosphorus reflect distinctive differences—in
Carpathian reservoirs average concentrations are more than 6 times lower than in
reservoirs with the highest concentrations—D˛ ebe, Rybnik and Turawa with values
above 0.180 mg P/L (Fig. 7.7).
A different distribution can be found as regards average nitrate nitrogen and phosphates. The limit value for class I water quality for dam reservoirs is 2.2 mg N-NO 3 /L.
Only in water of the Czaniec reservoir, this value was exceeded—2.96 mg N-NO 3 /L.
Fig. 7.6 Distribution of total nitrogen in analysed reservoirs